Immigrants from Colombia vs Yugoslavian Householder Income Over 65 years
COMPARE
Immigrants from Colombia
Yugoslavian
Householder Income Over 65 years
Householder Income Over 65 years Comparison
Immigrants from Colombia
Yugoslavians
$57,658
HOUSEHOLDER INCOME OVER 65 YEARS
3.0/ 100
METRIC RATING
229th/ 347
METRIC RANK
$58,243
HOUSEHOLDER INCOME OVER 65 YEARS
5.5/ 100
METRIC RATING
220th/ 347
METRIC RANK
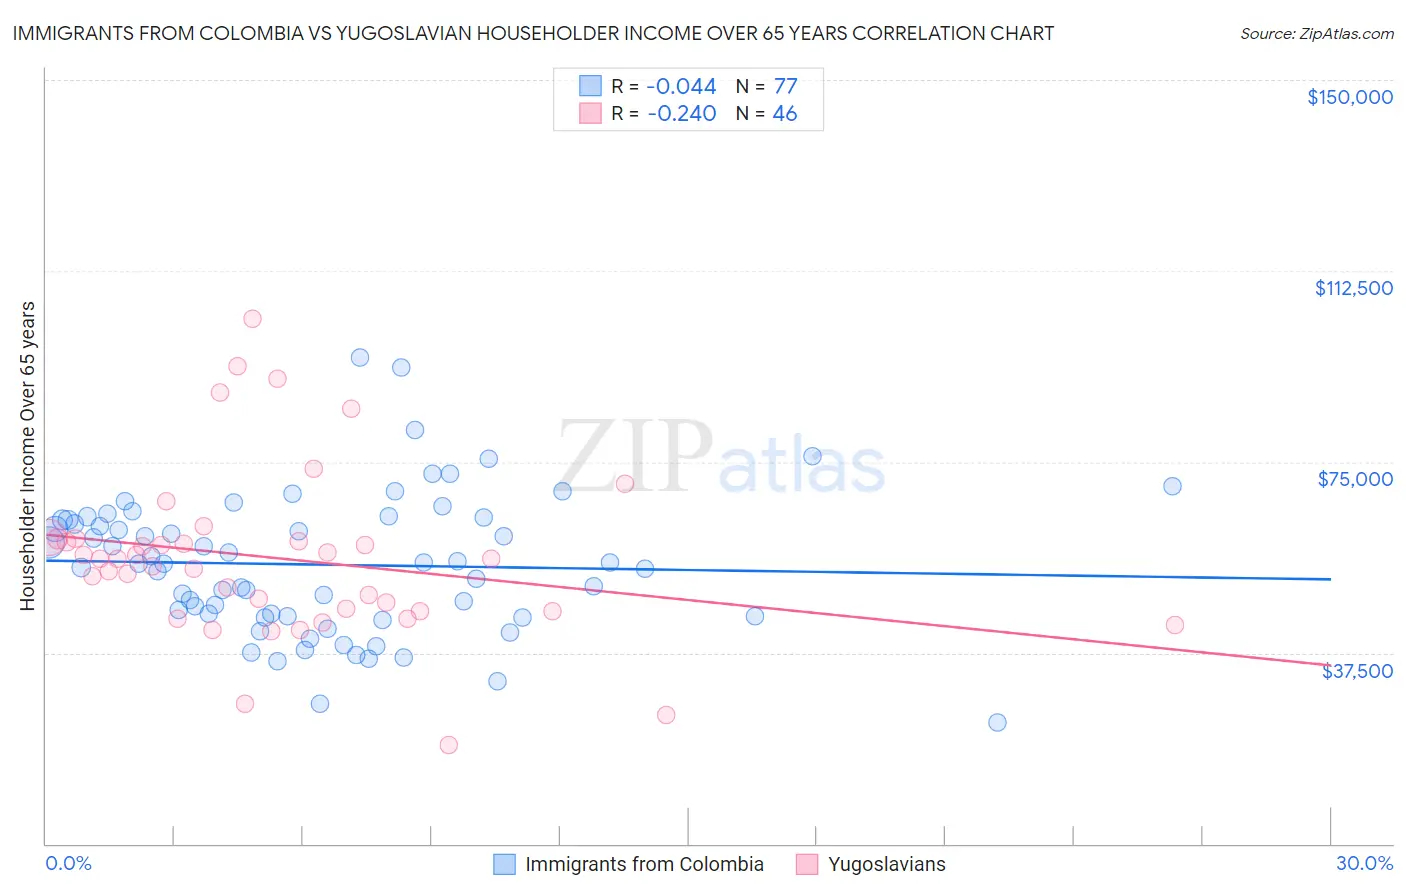
Immigrants from Colombia vs Yugoslavian Householder Income Over 65 years Correlation Chart
The statistical analysis conducted on geographies consisting of 377,569,928 people shows no correlation between the proportion of Immigrants from Colombia and household income with householder over the age of 65 in the United States with a correlation coefficient (R) of -0.044 and weighted average of $57,658. Similarly, the statistical analysis conducted on geographies consisting of 285,278,899 people shows a weak negative correlation between the proportion of Yugoslavians and household income with householder over the age of 65 in the United States with a correlation coefficient (R) of -0.240 and weighted average of $58,243, a difference of 1.0%.
Householder Income Over 65 years Correlation Summary
| Measurement | Immigrants from Colombia | Yugoslavian |
| Minimum | $23,750 | $19,307 |
| Maximum | $95,565 | $103,095 |
| Range | $71,815 | $83,788 |
| Mean | $54,810 | $56,075 |
| Median | $55,024 | $55,920 |
| Interquartile 25% (IQ1) | $44,579 | $45,775 |
| Interquartile 75% (IQ3) | $63,796 | $59,846 |
| Interquartile Range (IQR) | $19,217 | $14,071 |
| Standard Deviation (Sample) | $13,715 | $16,651 |
| Standard Deviation (Population) | $13,626 | $16,469 |
Demographics Similar to Immigrants from Colombia and Yugoslavians by Householder Income Over 65 years
In terms of householder income over 65 years, the demographic groups most similar to Immigrants from Colombia are Immigrants from Cambodia ($57,580, a difference of 0.14%), Immigrants from Albania ($57,828, a difference of 0.29%), Nonimmigrants ($57,426, a difference of 0.41%), Japanese ($57,919, a difference of 0.45%), and Immigrants from Venezuela ($57,371, a difference of 0.50%). Similarly, the demographic groups most similar to Yugoslavians are Malaysian ($58,244, a difference of 0.0%), Immigrants from El Salvador ($58,226, a difference of 0.030%), Panamanian ($58,266, a difference of 0.040%), Delaware ($58,214, a difference of 0.050%), and Sudanese ($58,281, a difference of 0.070%).
| Demographics | Rating | Rank | Householder Income Over 65 years |
| Nepalese | 9.0 /100 | #214 | Tragic $58,761 |
| Immigrants | Ghana | 7.9 /100 | #215 | Tragic $58,624 |
| Immigrants | Middle Africa | 6.2 /100 | #216 | Tragic $58,375 |
| Sudanese | 5.7 /100 | #217 | Tragic $58,281 |
| Panamanians | 5.6 /100 | #218 | Tragic $58,266 |
| Malaysians | 5.5 /100 | #219 | Tragic $58,244 |
| Yugoslavians | 5.5 /100 | #220 | Tragic $58,243 |
| Immigrants | El Salvador | 5.4 /100 | #221 | Tragic $58,226 |
| Delaware | 5.3 /100 | #222 | Tragic $58,214 |
| Tsimshian | 5.2 /100 | #223 | Tragic $58,202 |
| Bermudans | 5.1 /100 | #224 | Tragic $58,171 |
| Venezuelans | 4.4 /100 | #225 | Tragic $58,026 |
| French Canadians | 4.2 /100 | #226 | Tragic $57,975 |
| Japanese | 3.9 /100 | #227 | Tragic $57,919 |
| Immigrants | Albania | 3.6 /100 | #228 | Tragic $57,828 |
| Immigrants | Colombia | 3.0 /100 | #229 | Tragic $57,658 |
| Immigrants | Cambodia | 2.8 /100 | #230 | Tragic $57,580 |
| Immigrants | Nonimmigrants | 2.4 /100 | #231 | Tragic $57,426 |
| Immigrants | Venezuela | 2.3 /100 | #232 | Tragic $57,371 |
| Immigrants | Western Africa | 1.7 /100 | #233 | Tragic $57,119 |
| Immigrants | Burma/Myanmar | 1.7 /100 | #234 | Tragic $57,114 |