Tlingit-Haida vs Bahamian Unemployment Among Seniors over 65 years
COMPARE
Tlingit-Haida
Bahamian
Unemployment Among Seniors over 65 years
Unemployment Among Seniors over 65 years Comparison
Tlingit-Haida
Bahamians
6.8%
UNEMPLOYMENT AMONG SENIORS OVER 65 YEARS
0.0/ 100
METRIC RATING
343rd/ 347
METRIC RANK
5.3%
UNEMPLOYMENT AMONG SENIORS OVER 65 YEARS
0.9/ 100
METRIC RATING
242nd/ 347
METRIC RANK
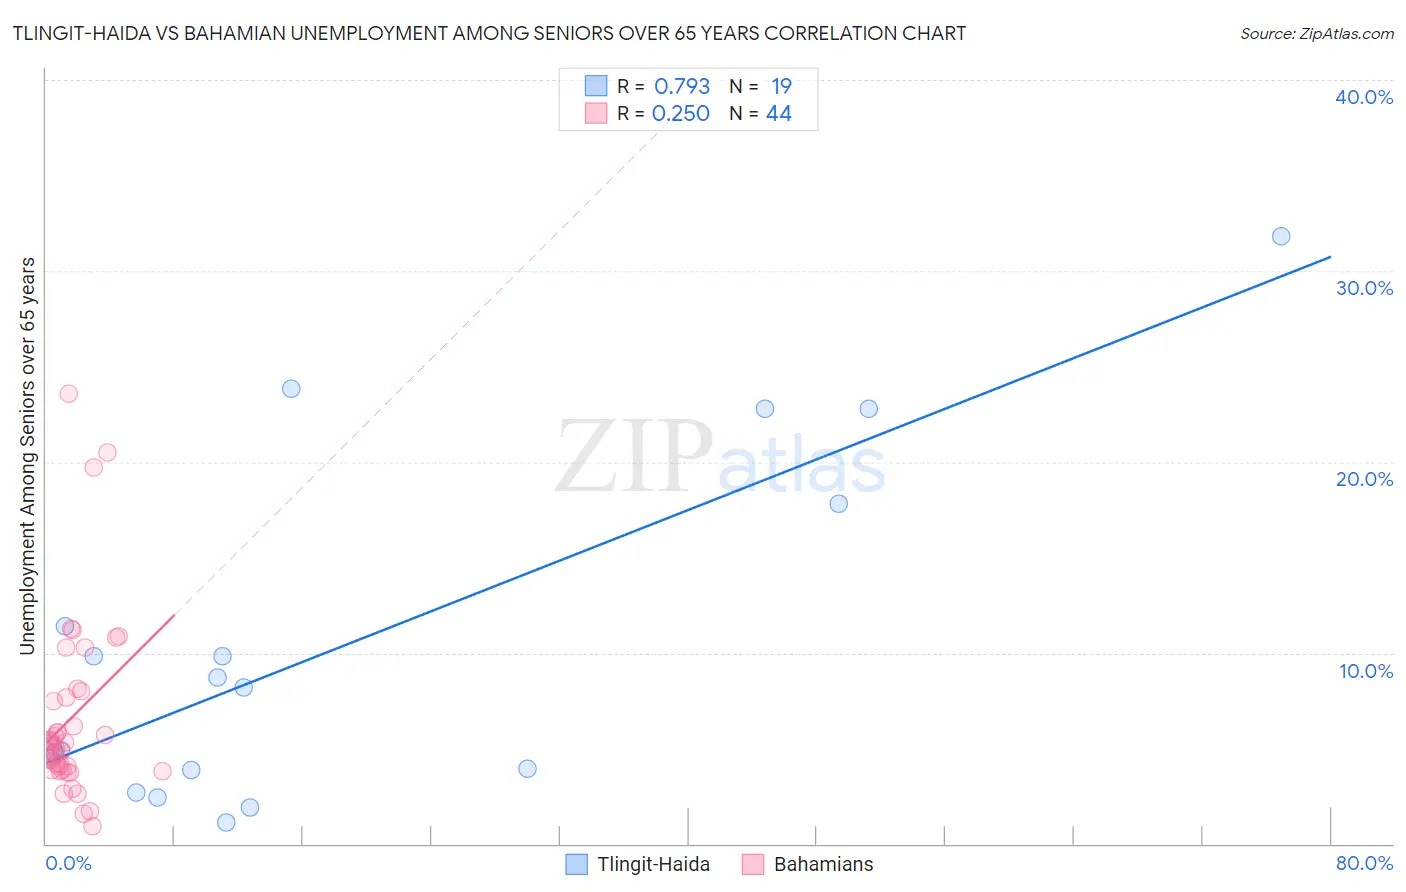
Tlingit-Haida vs Bahamian Unemployment Among Seniors over 65 years Correlation Chart
The statistical analysis conducted on geographies consisting of 57,782,692 people shows a strong positive correlation between the proportion of Tlingit-Haida and unemployment rate amomg seniors over the age of 65 in the United States with a correlation coefficient (R) of 0.793 and weighted average of 6.8%. Similarly, the statistical analysis conducted on geographies consisting of 107,457,827 people shows a weak positive correlation between the proportion of Bahamians and unemployment rate amomg seniors over the age of 65 in the United States with a correlation coefficient (R) of 0.250 and weighted average of 5.3%, a difference of 27.1%.
Unemployment Among Seniors over 65 years Correlation Summary
| Measurement | Tlingit-Haida | Bahamian |
| Minimum | 1.1% | 0.90% |
| Maximum | 31.8% | 23.6% |
| Range | 30.7% | 22.7% |
| Mean | 10.4% | 6.6% |
| Median | 8.2% | 5.0% |
| Interquartile 25% (IQ1) | 3.8% | 3.9% |
| Interquartile 75% (IQ3) | 17.8% | 7.8% |
| Interquartile Range (IQR) | 14.0% | 3.9% |
| Standard Deviation (Sample) | 9.0% | 4.8% |
| Standard Deviation (Population) | 8.8% | 4.8% |
Similar Demographics by Unemployment Among Seniors over 65 years
Demographics Similar to Tlingit-Haida by Unemployment Among Seniors over 65 years
In terms of unemployment among seniors over 65 years, the demographic groups most similar to Tlingit-Haida are Navajo (6.7%, a difference of 1.3%), Yakama (6.7%, a difference of 1.8%), Alaskan Athabascan (7.0%, a difference of 3.8%), Ute (6.3%, a difference of 7.2%), and Paiute (6.3%, a difference of 7.3%).
| Demographics | Rating | Rank | Unemployment Among Seniors over 65 years |
| Immigrants | Dominican Republic | 0.0 /100 | #333 | Tragic 6.0% |
| Tohono O'odham | 0.0 /100 | #334 | Tragic 6.1% |
| Immigrants | Armenia | 0.0 /100 | #335 | Tragic 6.2% |
| Pima | 0.0 /100 | #336 | Tragic 6.3% |
| Alaska Natives | 0.0 /100 | #337 | Tragic 6.3% |
| Immigrants | Azores | 0.0 /100 | #338 | Tragic 6.3% |
| Paiute | 0.0 /100 | #339 | Tragic 6.3% |
| Ute | 0.0 /100 | #340 | Tragic 6.3% |
| Yakama | 0.0 /100 | #341 | Tragic 6.7% |
| Navajo | 0.0 /100 | #342 | Tragic 6.7% |
| Tlingit-Haida | 0.0 /100 | #343 | Tragic 6.8% |
| Alaskan Athabascans | 0.0 /100 | #344 | Tragic 7.0% |
| Immigrants | Yemen | 0.0 /100 | #345 | Tragic 8.2% |
| Yup'ik | 0.0 /100 | #346 | Tragic 9.1% |
| Crow | 0.0 /100 | #347 | Tragic 16.9% |
Demographics Similar to Bahamians by Unemployment Among Seniors over 65 years
In terms of unemployment among seniors over 65 years, the demographic groups most similar to Bahamians are Nigerian (5.3%, a difference of 0.030%), Peruvian (5.3%, a difference of 0.13%), Ottawa (5.3%, a difference of 0.13%), Colombian (5.3%, a difference of 0.16%), and Immigrants from Caribbean (5.3%, a difference of 0.20%).
| Demographics | Rating | Rank | Unemployment Among Seniors over 65 years |
| Immigrants | Albania | 2.7 /100 | #235 | Tragic 5.3% |
| Immigrants | Costa Rica | 2.1 /100 | #236 | Tragic 5.3% |
| Immigrants | Greece | 2.0 /100 | #237 | Tragic 5.3% |
| Immigrants | Israel | 2.0 /100 | #238 | Tragic 5.3% |
| Immigrants | Senegal | 1.8 /100 | #239 | Tragic 5.3% |
| Immigrants | Trinidad and Tobago | 1.6 /100 | #240 | Tragic 5.3% |
| Apache | 1.3 /100 | #241 | Tragic 5.3% |
| Bahamians | 0.9 /100 | #242 | Tragic 5.3% |
| Nigerians | 0.9 /100 | #243 | Tragic 5.3% |
| Peruvians | 0.8 /100 | #244 | Tragic 5.3% |
| Ottawa | 0.8 /100 | #245 | Tragic 5.3% |
| Colombians | 0.7 /100 | #246 | Tragic 5.3% |
| Immigrants | Caribbean | 0.7 /100 | #247 | Tragic 5.3% |
| French Canadians | 0.7 /100 | #248 | Tragic 5.4% |
| Immigrants | Immigrants | 0.6 /100 | #249 | Tragic 5.4% |