Tlingit-Haida vs Bahamian Seniors Poverty Over the Age of 75
COMPARE
Tlingit-Haida
Bahamian
Seniors Poverty Over the Age of 75
Seniors Poverty Over the Age of 75 Comparison
Tlingit-Haida
Bahamians
9.7%
SENIORS POVERTY OVER THE AGE OF 75
100.0/ 100
METRIC RATING
2nd/ 347
METRIC RANK
15.5%
SENIORS POVERTY OVER THE AGE OF 75
0.0/ 100
METRIC RATING
300th/ 347
METRIC RANK
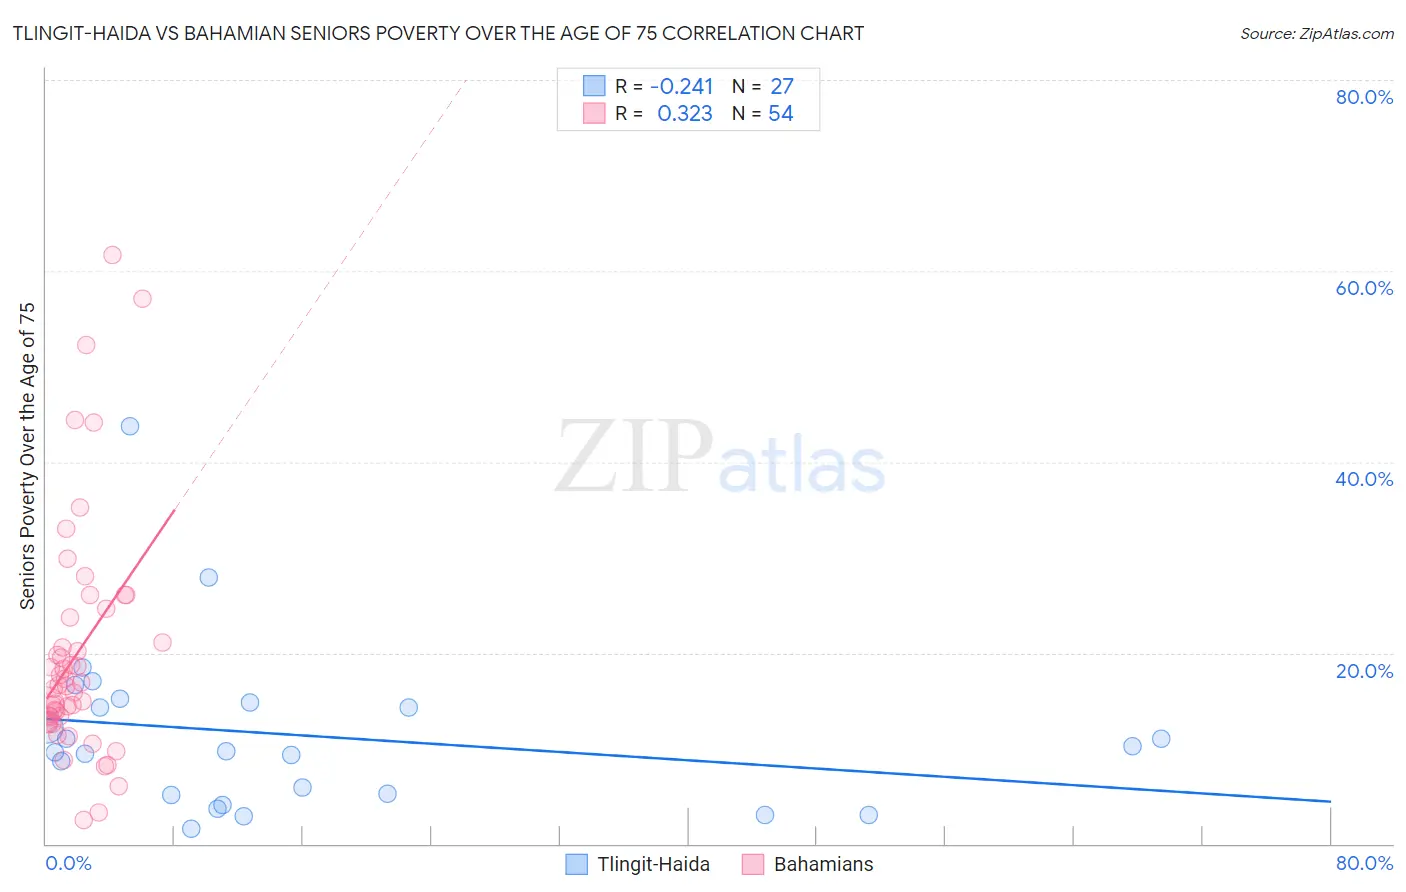
Tlingit-Haida vs Bahamian Seniors Poverty Over the Age of 75 Correlation Chart
The statistical analysis conducted on geographies consisting of 60,526,405 people shows a weak negative correlation between the proportion of Tlingit-Haida and poverty level among seniors over the age of 75 in the United States with a correlation coefficient (R) of -0.241 and weighted average of 9.7%. Similarly, the statistical analysis conducted on geographies consisting of 112,239,118 people shows a mild positive correlation between the proportion of Bahamians and poverty level among seniors over the age of 75 in the United States with a correlation coefficient (R) of 0.323 and weighted average of 15.5%, a difference of 59.9%.
Seniors Poverty Over the Age of 75 Correlation Summary
| Measurement | Tlingit-Haida | Bahamian |
| Minimum | 1.5% | 2.5% |
| Maximum | 43.8% | 61.7% |
| Range | 42.2% | 59.2% |
| Mean | 11.4% | 20.0% |
| Median | 9.7% | 16.5% |
| Interquartile 25% (IQ1) | 5.0% | 13.3% |
| Interquartile 75% (IQ3) | 14.8% | 23.7% |
| Interquartile Range (IQR) | 9.8% | 10.4% |
| Standard Deviation (Sample) | 8.8% | 12.4% |
| Standard Deviation (Population) | 8.7% | 12.3% |
Similar Demographics by Seniors Poverty Over the Age of 75
Demographics Similar to Tlingit-Haida by Seniors Poverty Over the Age of 75
In terms of seniors poverty over the age of 75, the demographic groups most similar to Tlingit-Haida are Native Hawaiian (10.1%, a difference of 3.8%), Swedish (10.2%, a difference of 4.7%), Norwegian (10.2%, a difference of 5.1%), Danish (10.2%, a difference of 5.4%), and Maltese (10.3%, a difference of 6.1%).
| Demographics | Rating | Rank | Seniors Poverty Over the Age of 75 |
| Chinese | 100.0 /100 | #1 | Exceptional 9.1% |
| Tlingit-Haida | 100.0 /100 | #2 | Exceptional 9.7% |
| Native Hawaiians | 100.0 /100 | #3 | Exceptional 10.1% |
| Swedes | 100.0 /100 | #4 | Exceptional 10.2% |
| Norwegians | 100.0 /100 | #5 | Exceptional 10.2% |
| Danes | 100.0 /100 | #6 | Exceptional 10.2% |
| Maltese | 100.0 /100 | #7 | Exceptional 10.3% |
| Germans | 99.9 /100 | #8 | Exceptional 10.4% |
| English | 99.9 /100 | #9 | Exceptional 10.4% |
| Scandinavians | 99.9 /100 | #10 | Exceptional 10.4% |
| Immigrants | India | 99.9 /100 | #11 | Exceptional 10.4% |
| Tongans | 99.9 /100 | #12 | Exceptional 10.5% |
| Croatians | 99.9 /100 | #13 | Exceptional 10.5% |
| Scottish | 99.9 /100 | #14 | Exceptional 10.5% |
| Europeans | 99.9 /100 | #15 | Exceptional 10.5% |
Demographics Similar to Bahamians by Seniors Poverty Over the Age of 75
In terms of seniors poverty over the age of 75, the demographic groups most similar to Bahamians are Spanish American Indian (15.5%, a difference of 0.010%), Native/Alaskan (15.5%, a difference of 0.11%), Honduran (15.4%, a difference of 0.45%), Yuman (15.4%, a difference of 0.73%), and Immigrants from Latin America (15.6%, a difference of 0.78%).
| Demographics | Rating | Rank | Seniors Poverty Over the Age of 75 |
| Apache | 0.0 /100 | #293 | Tragic 15.3% |
| Immigrants | Jamaica | 0.0 /100 | #294 | Tragic 15.3% |
| U.S. Virgin Islanders | 0.0 /100 | #295 | Tragic 15.4% |
| Yuman | 0.0 /100 | #296 | Tragic 15.4% |
| Hondurans | 0.0 /100 | #297 | Tragic 15.4% |
| Natives/Alaskans | 0.0 /100 | #298 | Tragic 15.5% |
| Spanish American Indians | 0.0 /100 | #299 | Tragic 15.5% |
| Bahamians | 0.0 /100 | #300 | Tragic 15.5% |
| Immigrants | Latin America | 0.0 /100 | #301 | Tragic 15.6% |
| West Indians | 0.0 /100 | #302 | Tragic 15.7% |
| Immigrants | Honduras | 0.0 /100 | #303 | Tragic 15.7% |
| Immigrants | Trinidad and Tobago | 0.0 /100 | #304 | Tragic 15.7% |
| Ecuadorians | 0.0 /100 | #305 | Tragic 15.7% |
| Hispanics or Latinos | 0.0 /100 | #306 | Tragic 15.8% |
| Immigrants | West Indies | 0.0 /100 | #307 | Tragic 15.8% |