Taiwanese vs White/Caucasian Wage/Income Gap

COMPARE

Taiwanese
Race
Ancestry
AfghanAfricanAlaska NativeAlaskan AthabascanAlbanianAleutAlsatianAmericanApacheArabArapahoArgentineanArmenianAssyrian/Chaldean/SyriacAustralianAustrianBahamianBangladeshiBarbadianBasqueBelgianBelizeanBermudanBhutaneseBlackfeetBolivianBrazilianBritishBritish West IndianBulgarianBurmeseCajunCambodianCanadianCape VerdeanCarpatho RusynCelticCentral AmericanCentral American IndianCherokeeCheyenneChickasawChileanChineseChippewaChoctawColombianColvilleComancheCosta RicanCreeCreekCroatianCrowCubanCypriotCzechCzechoslovakianDanishDelawareDominicanDutchDutch West IndianEastern EuropeanEcuadorianEgyptianEnglishEstonianEthiopianEuropeanFijianFilipinoFinnishFrenchFrench American IndianFrench CanadianGermanGerman RussianGhanaianGreekGuamanian/ChamorroGuatemalanGuyaneseHaitianHmongHonduranHopiHoumaHungarianIcelanderIndian (Asian)IndonesianInupiatIranianIraqiIrishIroquoisIsraeliItalianJamaicanJapaneseJordanianKenyanKiowaKoreanLaotianLatvianLebaneseLiberianLithuanianLumbeeLuxembourgerMacedonianMalaysianMalteseMarshalleseMenomineeMexicanMexican American IndianMongolianMoroccanNative HawaiianNavajoNepaleseNew ZealanderNicaraguanNigerianNorthern EuropeanNorwegianOkinawanOsageOttawaPaiutePakistaniPalestinianPanamanianParaguayanPennsylvania GermanPeruvianPimaPolishPortuguesePotawatomiPuebloPuerto RicanPuget Sound SalishRomanianRussianSalvadoranSamoanScandinavianScotch-IrishScottishSeminoleSenegaleseSerbianShoshoneSierra LeoneanSiouxSlavicSlovakSloveneSomaliSouth AfricanSouth AmericanSouth American IndianSoviet UnionSpaniardSpanishSpanish AmericanSpanish American IndianSri LankanSubsaharan AfricanSudaneseSwedishSwissSyrianTaiwaneseThaiTlingit-HaidaTohono O'OdhamTonganTrinidadian and TobagonianTsimshianTurkishU.S. Virgin IslanderUgandanUkrainianUruguayanUteVenezuelanVietnameseWelshWest IndianYakamaYaquiYugoslavianYumanYup'ikZimbabwean
Immigration
NonimmigrantsImmigrantsAfghanistanAfricaAlbaniaArgentinaArmeniaAsiaAustraliaAustriaBahamasBangladeshBarbadosBelarusBelgiumBelizeBoliviaBosnia and HerzegovinaBrazilBulgariaBurma/MyanmarCabo VerdeCambodiaCameroonCanadaCaribbeanCentral AmericaChileChinaColombiaCongoCosta RicaCroatiaCubaCzechoslovakiaDenmarkDominicaDominican RepublicEastern AfricaEastern AsiaEastern EuropeEcuadorEgyptEl SalvadorEnglandEritreaEthiopiaEuropeFijiFranceGermanyGhanaGreeceGrenadaGuatemalaGuyanaHaitiHondurasHong KongHungaryIndiaIndonesiaIranIraqIrelandIsraelItalyJamaicaJapanJordanKazakhstanKenyaKoreaKuwaitLaosLatin AmericaLatviaLebanonLiberiaLithuaniaMalaysiaMexicoMicronesiaMiddle AfricaMoldovaMoroccoNepalNetherlandsNicaraguaNigeriaNorth AmericaNorth MacedoniaNorthern AfricaNorthern EuropeNorwayOceaniaPakistanPanamaPeruPhilippinesPolandPortugalRomaniaRussiaSaudi ArabiaScotlandSenegalSerbiaSierra LeoneSingaporeSomaliaSouth AfricaSouth AmericaSouth Central AsiaSouth Eastern AsiaSouthern EuropeSpainSri LankaSt. Vincent and the GrenadinesSudanSwedenSwitzerlandSyriaTaiwanThailandTrinidad and TobagoTurkeyUgandaUkraineUruguayUzbekistanVenezuelaVietnamWest IndiesWestern AfricaWestern AsiaWestern EuropeYemenZaireZimbabweAzores
White/Caucasian
Race
Ancestry
AfghanAfricanAlaska NativeAlaskan AthabascanAlbanianAleutAlsatianAmericanApacheArabArapahoArgentineanArmenianAssyrian/Chaldean/SyriacAustralianAustrianBahamianBangladeshiBarbadianBasqueBelgianBelizeanBermudanBhutaneseBlackfeetBolivianBrazilianBritishBritish West IndianBulgarianBurmeseCajunCambodianCanadianCape VerdeanCarpatho RusynCelticCentral AmericanCentral American IndianCherokeeCheyenneChickasawChileanChineseChippewaChoctawColombianColvilleComancheCosta RicanCreeCreekCroatianCrowCubanCypriotCzechCzechoslovakianDanishDelawareDominicanDutchDutch West IndianEastern EuropeanEcuadorianEgyptianEnglishEstonianEthiopianEuropeanFijianFilipinoFinnishFrenchFrench American IndianFrench CanadianGermanGerman RussianGhanaianGreekGuamanian/ChamorroGuatemalanGuyaneseHaitianHmongHonduranHopiHoumaHungarianIcelanderIndian (Asian)IndonesianInupiatIranianIraqiIrishIroquoisIsraeliItalianJamaicanJapaneseJordanianKenyanKiowaKoreanLaotianLatvianLebaneseLiberianLithuanianLumbeeLuxembourgerMacedonianMalaysianMalteseMarshalleseMenomineeMexicanMexican American IndianMongolianMoroccanNative HawaiianNavajoNepaleseNew ZealanderNicaraguanNigerianNorthern EuropeanNorwegianOkinawanOsageOttawaPaiutePakistaniPalestinianPanamanianParaguayanPennsylvania GermanPeruvianPimaPolishPortuguesePotawatomiPuebloPuerto RicanPuget Sound SalishRomanianRussianSalvadoranSamoanScandinavianScotch-IrishScottishSeminoleSenegaleseSerbianShoshoneSierra LeoneanSiouxSlavicSlovakSloveneSomaliSouth AfricanSouth AmericanSouth American IndianSoviet UnionSpaniardSpanishSpanish AmericanSpanish American IndianSri LankanSubsaharan AfricanSudaneseSwedishSwissSyrianThaiTlingit-HaidaTohono O'OdhamTonganTrinidadian and TobagonianTsimshianTurkishU.S. Virgin IslanderUgandanUkrainianUruguayanUteVenezuelanVietnameseWelshWest IndianYakamaYaquiYugoslavianYumanYup'ikZimbabwean
Immigration
NonimmigrantsImmigrantsAfghanistanAfricaAlbaniaArgentinaArmeniaAsiaAustraliaAustriaBahamasBangladeshBarbadosBelarusBelgiumBelizeBoliviaBosnia and HerzegovinaBrazilBulgariaBurma/MyanmarCabo VerdeCambodiaCameroonCanadaCaribbeanCentral AmericaChileChinaColombiaCongoCosta RicaCroatiaCubaCzechoslovakiaDenmarkDominicaDominican RepublicEastern AfricaEastern AsiaEastern EuropeEcuadorEgyptEl SalvadorEnglandEritreaEthiopiaEuropeFijiFranceGermanyGhanaGreeceGrenadaGuatemalaGuyanaHaitiHondurasHong KongHungaryIndiaIndonesiaIranIraqIrelandIsraelItalyJamaicaJapanJordanKazakhstanKenyaKoreaKuwaitLaosLatin AmericaLatviaLebanonLiberiaLithuaniaMalaysiaMexicoMicronesiaMiddle AfricaMoldovaMoroccoNepalNetherlandsNicaraguaNigeriaNorth AmericaNorth MacedoniaNorthern AfricaNorthern EuropeNorwayOceaniaPakistanPanamaPeruPhilippinesPolandPortugalRomaniaRussiaSaudi ArabiaScotlandSenegalSerbiaSierra LeoneSingaporeSomaliaSouth AfricaSouth AmericaSouth Central AsiaSouth Eastern AsiaSouthern EuropeSpainSri LankaSt. Vincent and the GrenadinesSudanSwedenSwitzerlandSyriaTaiwanThailandTrinidad and TobagoTurkeyUgandaUkraineUruguayUzbekistanVenezuelaVietnamWest IndiesWestern AfricaWestern AsiaWestern EuropeYemenZaireZimbabweAzores
Wage/Income Gap
Income
Poverty
Unemployment
Labor Participation
Family Structure
Vehicle Availability
Education Level
Disability

Wage/Income Gap Comparison

Taiwanese

Whites/Caucasians

Excellent
Tragic
25.1%
WAGE/INCOME GAP
81.6/ 100
METRIC RATING
151st/ 347
METRIC RANK
28.5%
WAGE/INCOME GAP
0.1/ 100
METRIC RATING
306th/ 347
METRIC RANK

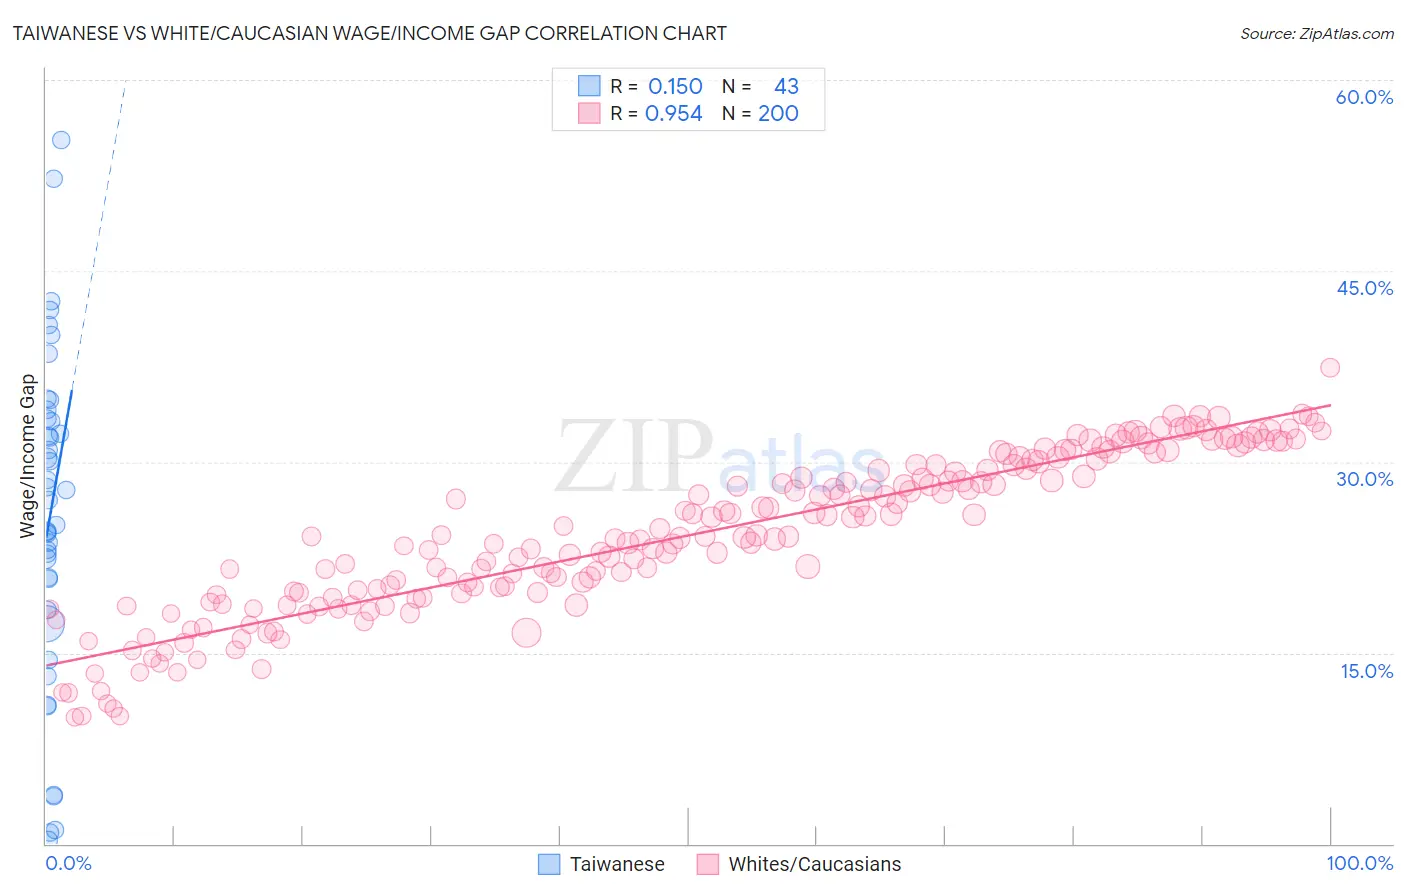
Taiwanese vs White/Caucasian Wage/Income Gap Correlation Chart

The statistical analysis conducted on geographies consisting of 31,719,634 people shows a poor positive correlation between the proportion of Taiwanese and wage/income gap percentage in the United States with a correlation coefficient (R) of 0.150 and weighted average of 25.1%. Similarly, the statistical analysis conducted on geographies consisting of 580,089,064 people shows a perfect positive correlation between the proportion of Whites/Caucasians and wage/income gap percentage in the United States with a correlation coefficient (R) of 0.954 and weighted average of 28.5%, a difference of 13.4%.
Taiwanese vs White/Caucasian Wage/Income Gap

Wage/Income Gap Correlation Summary

MeasurementTaiwaneseWhite/Caucasian
Minimum0.32%9.9%
Maximum55.3%37.4%
Range55.0%27.5%
Mean25.8%24.2%
Median27.0%24.1%
Interquartile 25% (IQ1)18.4%19.6%
Interquartile 75% (IQ3)33.4%29.7%
Interquartile Range (IQR)15.0%10.1%
Standard Deviation (Sample)13.0%6.2%
Standard Deviation (Population)12.8%6.2%

Similar Demographics by Wage/Income Gap

Demographics Similar to Taiwanese by Wage/Income Gap

In terms of wage/income gap, the demographic groups most similar to Taiwanese are Uruguayan (25.2%, a difference of 0.030%), Immigrants (25.1%, a difference of 0.080%), Immigrants from Peru (25.1%, a difference of 0.12%), Iroquois (25.1%, a difference of 0.27%), and Blackfeet (25.2%, a difference of 0.36%).
DemographicsRating | RankWage/Income Gap
Chippewa
86.9
/100
|
#144
Excellent
25.0%
Comanche
85.2
/100
|
#145
Excellent
25.0%
South Americans
85.2
/100
|
#146
Excellent
25.0%
Malaysians
84.9
/100
|
#147
Excellent
25.0%
Iroquois
83.9
/100
|
#148
Excellent
25.1%
Immigrants | Peru
82.6
/100
|
#149
Excellent
25.1%
Immigrants | Immigrants
82.3
/100
|
#150
Excellent
25.1%
Taiwanese
81.6
/100
|
#151
Excellent
25.1%
Uruguayans
81.3
/100
|
#152
Excellent
25.2%
Blackfeet
78.1
/100
|
#153
Good
25.2%
Immigrants | Northern Africa
78.1
/100
|
#154
Good
25.2%
Immigrants | Vietnam
77.7
/100
|
#155
Good
25.2%
Immigrants | Mexico
76.4
/100
|
#156
Good
25.3%
Costa Ricans
75.8
/100
|
#157
Good
25.3%
Immigrants | Zimbabwe
73.7
/100
|
#158
Good
25.3%

Demographics Similar to Whites/Caucasians by Wage/Income Gap

In terms of wage/income gap, the demographic groups most similar to Whites/Caucasians are Immigrants from Denmark (28.5%, a difference of 0.010%), Immigrants from South Africa (28.5%, a difference of 0.050%), Immigrants from Netherlands (28.5%, a difference of 0.060%), Polish (28.5%, a difference of 0.080%), and Scotch-Irish (28.5%, a difference of 0.14%).
DemographicsRating | RankWage/Income Gap
Immigrants | North Macedonia
0.2
/100
|
#299
Tragic
28.4%
Immigrants | Northern Europe
0.2
/100
|
#300
Tragic
28.5%
Immigrants | Canada
0.2
/100
|
#301
Tragic
28.5%
Scotch-Irish
0.2
/100
|
#302
Tragic
28.5%
Irish
0.2
/100
|
#303
Tragic
28.5%
Immigrants | Netherlands
0.2
/100
|
#304
Tragic
28.5%
Immigrants | South Africa
0.1
/100
|
#305
Tragic
28.5%
Whites/Caucasians
0.1
/100
|
#306
Tragic
28.5%
Immigrants | Denmark
0.1
/100
|
#307
Tragic
28.5%
Poles
0.1
/100
|
#308
Tragic
28.5%
Macedonians
0.1
/100
|
#309
Tragic
28.6%
Finns
0.1
/100
|
#310
Tragic
28.6%
Immigrants | Lithuania
0.1
/100
|
#311
Tragic
28.6%
Eastern Europeans
0.1
/100
|
#312
Tragic
28.6%
French
0.1
/100
|
#313
Tragic
28.7%