Syrian vs Immigrants from Bosnia and Herzegovina 12th Grade, No Diploma
COMPARE
Syrian
Immigrants from Bosnia and Herzegovina
12th Grade, No Diploma
12th Grade, No Diploma Comparison
Syrians
Immigrants from Bosnia and Herzegovina
92.2%
12TH GRADE, NO DIPLOMA
97.2/ 100
METRIC RATING
107th/ 347
METRIC RANK
91.7%
12TH GRADE, NO DIPLOMA
87.3/ 100
METRIC RATING
135th/ 347
METRIC RANK
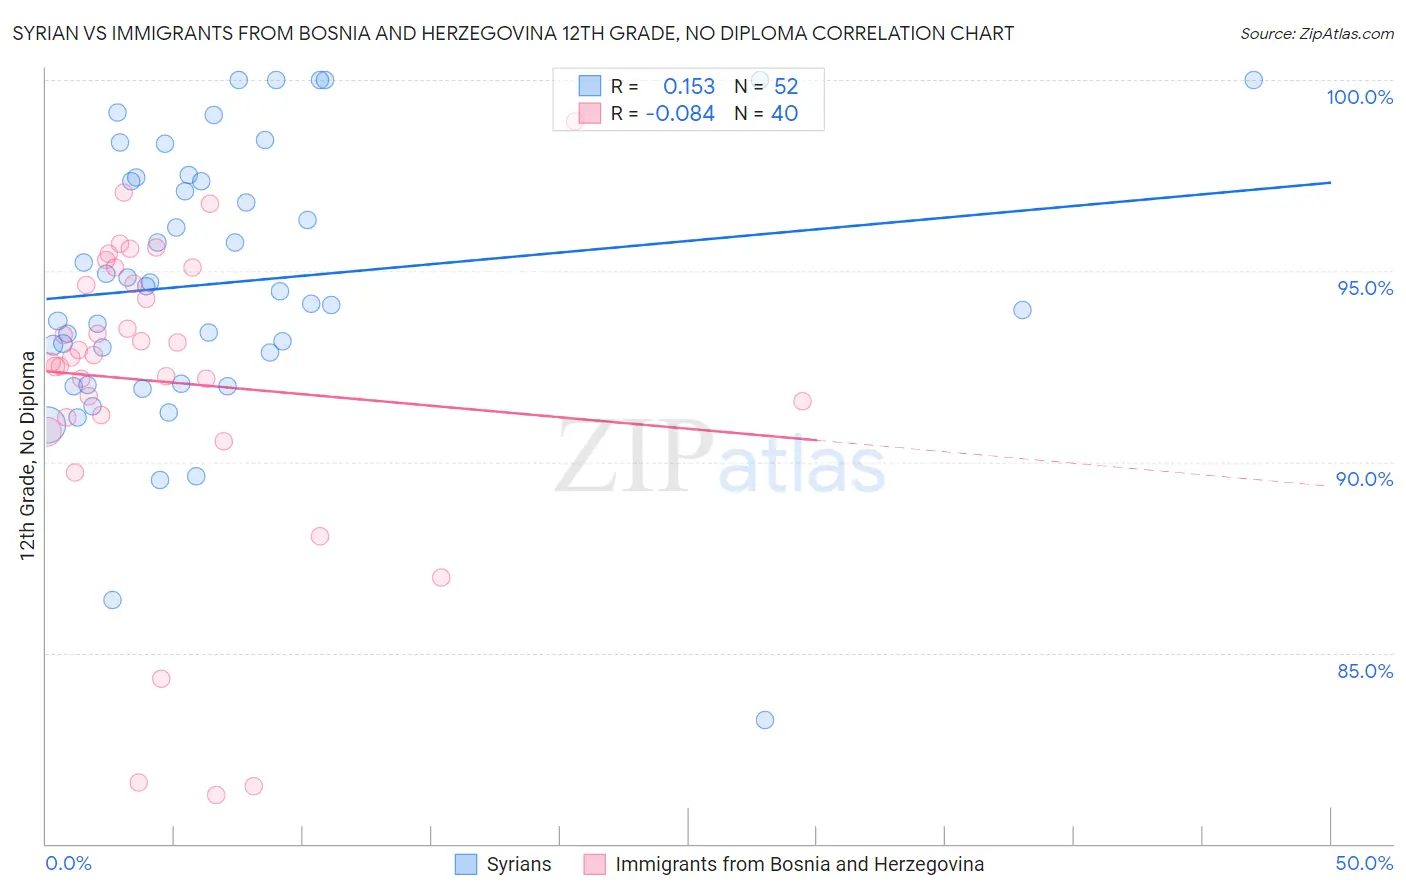
Syrian vs Immigrants from Bosnia and Herzegovina 12th Grade, No Diploma Correlation Chart
The statistical analysis conducted on geographies consisting of 266,306,452 people shows a poor positive correlation between the proportion of Syrians and percentage of population with at least 12th grade (no diploma) education in the United States with a correlation coefficient (R) of 0.153 and weighted average of 92.2%. Similarly, the statistical analysis conducted on geographies consisting of 156,819,615 people shows a slight negative correlation between the proportion of Immigrants from Bosnia and Herzegovina and percentage of population with at least 12th grade (no diploma) education in the United States with a correlation coefficient (R) of -0.084 and weighted average of 91.7%, a difference of 0.50%.
12th Grade, No Diploma Correlation Summary
| Measurement | Syrian | Immigrants from Bosnia and Herzegovina |
| Minimum | 83.2% | 81.3% |
| Maximum | 100.0% | 98.9% |
| Range | 16.8% | 17.7% |
| Mean | 94.7% | 92.1% |
| Median | 94.5% | 92.8% |
| Interquartile 25% (IQ1) | 92.5% | 91.2% |
| Interquartile 75% (IQ3) | 97.4% | 94.9% |
| Interquartile Range (IQR) | 5.0% | 3.7% |
| Standard Deviation (Sample) | 3.6% | 4.1% |
| Standard Deviation (Population) | 3.5% | 4.0% |
Similar Demographics by 12th Grade, No Diploma
Demographics Similar to Syrians by 12th Grade, No Diploma
In terms of 12th grade, no diploma, the demographic groups most similar to Syrians are Immigrants from Russia (92.2%, a difference of 0.010%), Jordanian (92.2%, a difference of 0.010%), Immigrants from Belarus (92.2%, a difference of 0.020%), Immigrants from Hungary (92.1%, a difference of 0.020%), and Palestinian (92.1%, a difference of 0.030%).
| Demographics | Rating | Rank | 12th Grade, No Diploma |
| Immigrants | Croatia | 98.3 /100 | #100 | Exceptional 92.3% |
| Swiss | 98.1 /100 | #101 | Exceptional 92.3% |
| Alaskan Athabascans | 98.1 /100 | #102 | Exceptional 92.3% |
| Immigrants | Norway | 98.1 /100 | #103 | Exceptional 92.3% |
| Lebanese | 97.6 /100 | #104 | Exceptional 92.2% |
| Immigrants | Belarus | 97.4 /100 | #105 | Exceptional 92.2% |
| Immigrants | Russia | 97.3 /100 | #106 | Exceptional 92.2% |
| Syrians | 97.2 /100 | #107 | Exceptional 92.2% |
| Jordanians | 97.2 /100 | #108 | Exceptional 92.2% |
| Immigrants | Hungary | 97.0 /100 | #109 | Exceptional 92.1% |
| Palestinians | 97.0 /100 | #110 | Exceptional 92.1% |
| Immigrants | Greece | 96.9 /100 | #111 | Exceptional 92.1% |
| Israelis | 96.8 /100 | #112 | Exceptional 92.1% |
| Immigrants | Zimbabwe | 96.5 /100 | #113 | Exceptional 92.1% |
| Yugoslavians | 96.5 /100 | #114 | Exceptional 92.1% |
Demographics Similar to Immigrants from Bosnia and Herzegovina by 12th Grade, No Diploma
In terms of 12th grade, no diploma, the demographic groups most similar to Immigrants from Bosnia and Herzegovina are Immigrants from Italy (91.7%, a difference of 0.030%), Venezuelan (91.7%, a difference of 0.030%), Chilean (91.7%, a difference of 0.040%), Albanian (91.8%, a difference of 0.060%), and Immigrants from Eastern Asia (91.8%, a difference of 0.060%).
| Demographics | Rating | Rank | 12th Grade, No Diploma |
| Mongolians | 89.9 /100 | #128 | Excellent 91.8% |
| German Russians | 89.8 /100 | #129 | Excellent 91.8% |
| Assyrians/Chaldeans/Syriacs | 89.6 /100 | #130 | Excellent 91.8% |
| Albanians | 89.3 /100 | #131 | Excellent 91.8% |
| Immigrants | Eastern Asia | 89.3 /100 | #132 | Excellent 91.8% |
| Immigrants | Italy | 88.3 /100 | #133 | Excellent 91.7% |
| Venezuelans | 88.2 /100 | #134 | Excellent 91.7% |
| Immigrants | Bosnia and Herzegovina | 87.3 /100 | #135 | Excellent 91.7% |
| Chileans | 85.8 /100 | #136 | Excellent 91.7% |
| Alaska Natives | 84.9 /100 | #137 | Excellent 91.6% |
| Arabs | 84.1 /100 | #138 | Excellent 91.6% |
| Immigrants | Egypt | 83.9 /100 | #139 | Excellent 91.6% |
| Immigrants | Poland | 82.3 /100 | #140 | Excellent 91.6% |
| Argentineans | 82.0 /100 | #141 | Excellent 91.6% |
| Immigrants | Venezuela | 80.9 /100 | #142 | Excellent 91.6% |