Syrian vs Immigrants from Bosnia and Herzegovina Householder Income Over 65 years
COMPARE
Syrian
Immigrants from Bosnia and Herzegovina
Householder Income Over 65 years
Householder Income Over 65 years Comparison
Syrians
Immigrants from Bosnia and Herzegovina
$63,494
HOUSEHOLDER INCOME OVER 65 YEARS
93.4/ 100
METRIC RATING
112th/ 347
METRIC RANK
$55,986
HOUSEHOLDER INCOME OVER 65 YEARS
0.5/ 100
METRIC RATING
250th/ 347
METRIC RANK
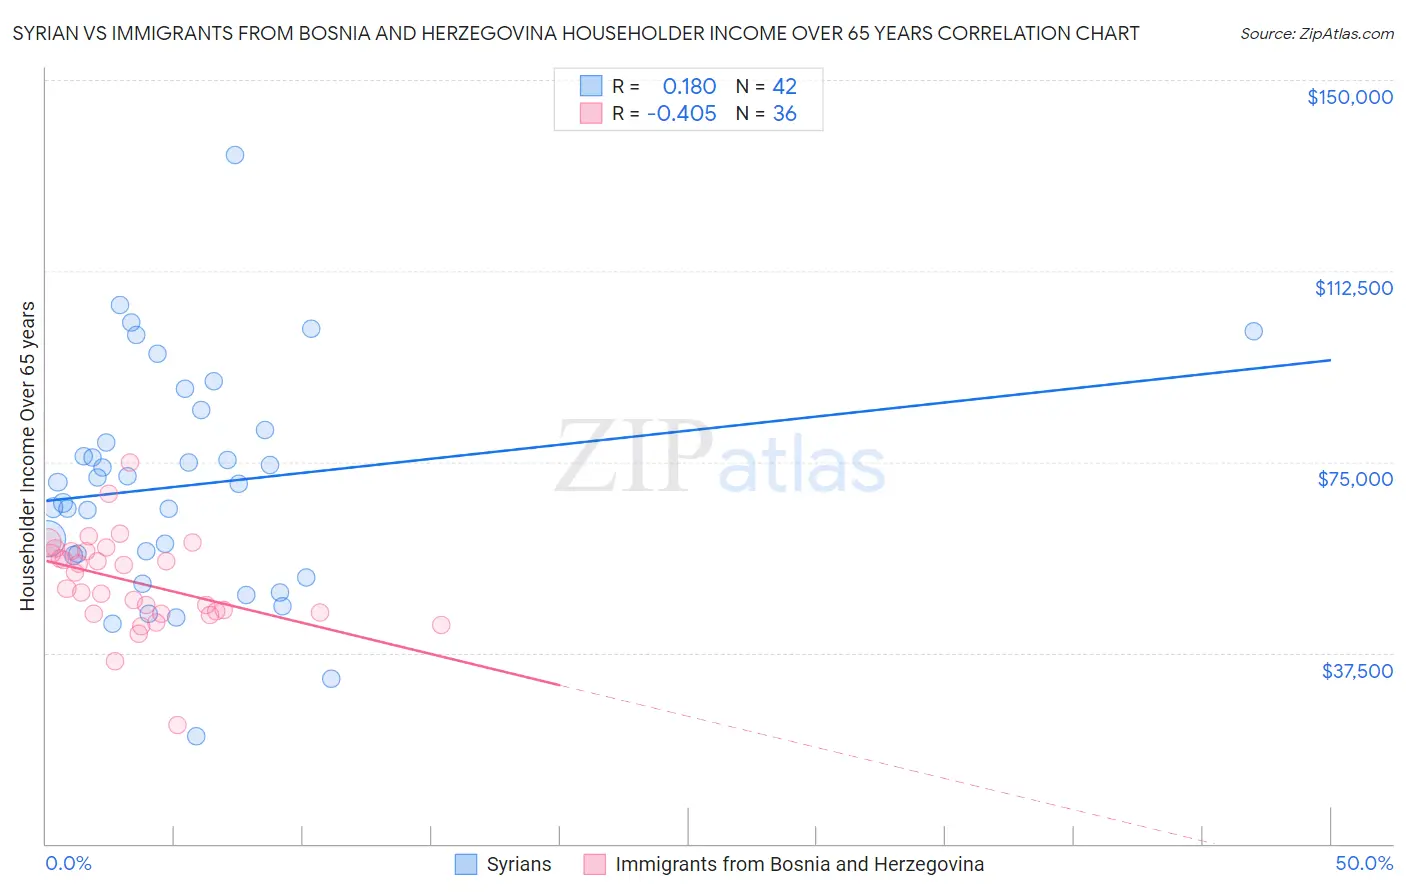
Syrian vs Immigrants from Bosnia and Herzegovina Householder Income Over 65 years Correlation Chart
The statistical analysis conducted on geographies consisting of 265,818,751 people shows a poor positive correlation between the proportion of Syrians and household income with householder over the age of 65 in the United States with a correlation coefficient (R) of 0.180 and weighted average of $63,494. Similarly, the statistical analysis conducted on geographies consisting of 156,709,633 people shows a moderate negative correlation between the proportion of Immigrants from Bosnia and Herzegovina and household income with householder over the age of 65 in the United States with a correlation coefficient (R) of -0.405 and weighted average of $55,986, a difference of 13.4%.
Householder Income Over 65 years Correlation Summary
| Measurement | Syrian | Immigrants from Bosnia and Herzegovina |
| Minimum | $21,115 | $23,391 |
| Maximum | $135,278 | $74,953 |
| Range | $114,162 | $51,562 |
| Mean | $70,420 | $51,359 |
| Median | $70,855 | $51,669 |
| Interquartile 25% (IQ1) | $56,590 | $45,302 |
| Interquartile 75% (IQ3) | $81,250 | $57,366 |
| Interquartile Range (IQR) | $24,660 | $12,064 |
| Standard Deviation (Sample) | $22,192 | $9,347 |
| Standard Deviation (Population) | $21,926 | $9,217 |
Similar Demographics by Householder Income Over 65 years
Demographics Similar to Syrians by Householder Income Over 65 years
In terms of householder income over 65 years, the demographic groups most similar to Syrians are Immigrants from Spain ($63,540, a difference of 0.070%), Immigrants from Serbia ($63,387, a difference of 0.17%), Immigrants from Saudi Arabia ($63,355, a difference of 0.22%), Immigrants from Zimbabwe ($63,643, a difference of 0.24%), and Croatian ($63,225, a difference of 0.43%).
| Demographics | Rating | Rank | Householder Income Over 65 years |
| Italians | 95.5 /100 | #105 | Exceptional $63,885 |
| Immigrants | Argentina | 95.5 /100 | #106 | Exceptional $63,885 |
| Pakistanis | 95.3 /100 | #107 | Exceptional $63,844 |
| Palestinians | 95.1 /100 | #108 | Exceptional $63,800 |
| Europeans | 95.0 /100 | #109 | Exceptional $63,779 |
| Immigrants | Zimbabwe | 94.3 /100 | #110 | Exceptional $63,643 |
| Immigrants | Spain | 93.7 /100 | #111 | Exceptional $63,540 |
| Syrians | 93.4 /100 | #112 | Exceptional $63,494 |
| Immigrants | Serbia | 92.7 /100 | #113 | Exceptional $63,387 |
| Immigrants | Saudi Arabia | 92.4 /100 | #114 | Exceptional $63,355 |
| Croatians | 91.4 /100 | #115 | Exceptional $63,225 |
| Guamanians/Chamorros | 91.1 /100 | #116 | Exceptional $63,187 |
| Immigrants | Croatia | 90.9 /100 | #117 | Exceptional $63,168 |
| Danes | 90.5 /100 | #118 | Exceptional $63,117 |
| Immigrants | Jordan | 89.8 /100 | #119 | Excellent $63,041 |
Demographics Similar to Immigrants from Bosnia and Herzegovina by Householder Income Over 65 years
In terms of householder income over 65 years, the demographic groups most similar to Immigrants from Bosnia and Herzegovina are Immigrants from Portugal ($55,924, a difference of 0.11%), Mexican American Indian ($56,089, a difference of 0.19%), Vietnamese ($56,143, a difference of 0.28%), Yakama ($56,234, a difference of 0.44%), and Osage ($55,677, a difference of 0.55%).
| Demographics | Rating | Rank | Householder Income Over 65 years |
| Guyanese | 0.8 /100 | #243 | Tragic $56,351 |
| Hmong | 0.8 /100 | #244 | Tragic $56,339 |
| Immigrants | Uzbekistan | 0.8 /100 | #245 | Tragic $56,331 |
| Central Americans | 0.8 /100 | #246 | Tragic $56,321 |
| Yakama | 0.7 /100 | #247 | Tragic $56,234 |
| Vietnamese | 0.6 /100 | #248 | Tragic $56,143 |
| Mexican American Indians | 0.6 /100 | #249 | Tragic $56,089 |
| Immigrants | Bosnia and Herzegovina | 0.5 /100 | #250 | Tragic $55,986 |
| Immigrants | Portugal | 0.5 /100 | #251 | Tragic $55,924 |
| Osage | 0.4 /100 | #252 | Tragic $55,677 |
| Immigrants | Trinidad and Tobago | 0.4 /100 | #253 | Tragic $55,598 |
| Americans | 0.3 /100 | #254 | Tragic $55,527 |
| Immigrants | Bangladesh | 0.3 /100 | #255 | Tragic $55,394 |
| German Russians | 0.3 /100 | #256 | Tragic $55,356 |
| Trinidadians and Tobagonians | 0.3 /100 | #257 | Tragic $55,327 |