Syrian vs Immigrants from Belgium Median Female Earnings
COMPARE
Syrian
Immigrants from Belgium
Median Female Earnings
Median Female Earnings Comparison
Syrians
Immigrants from Belgium
$40,727
MEDIAN FEMALE EARNINGS
89.5/ 100
METRIC RATING
133rd/ 347
METRIC RANK
$44,587
MEDIAN FEMALE EARNINGS
100.0/ 100
METRIC RATING
29th/ 347
METRIC RANK
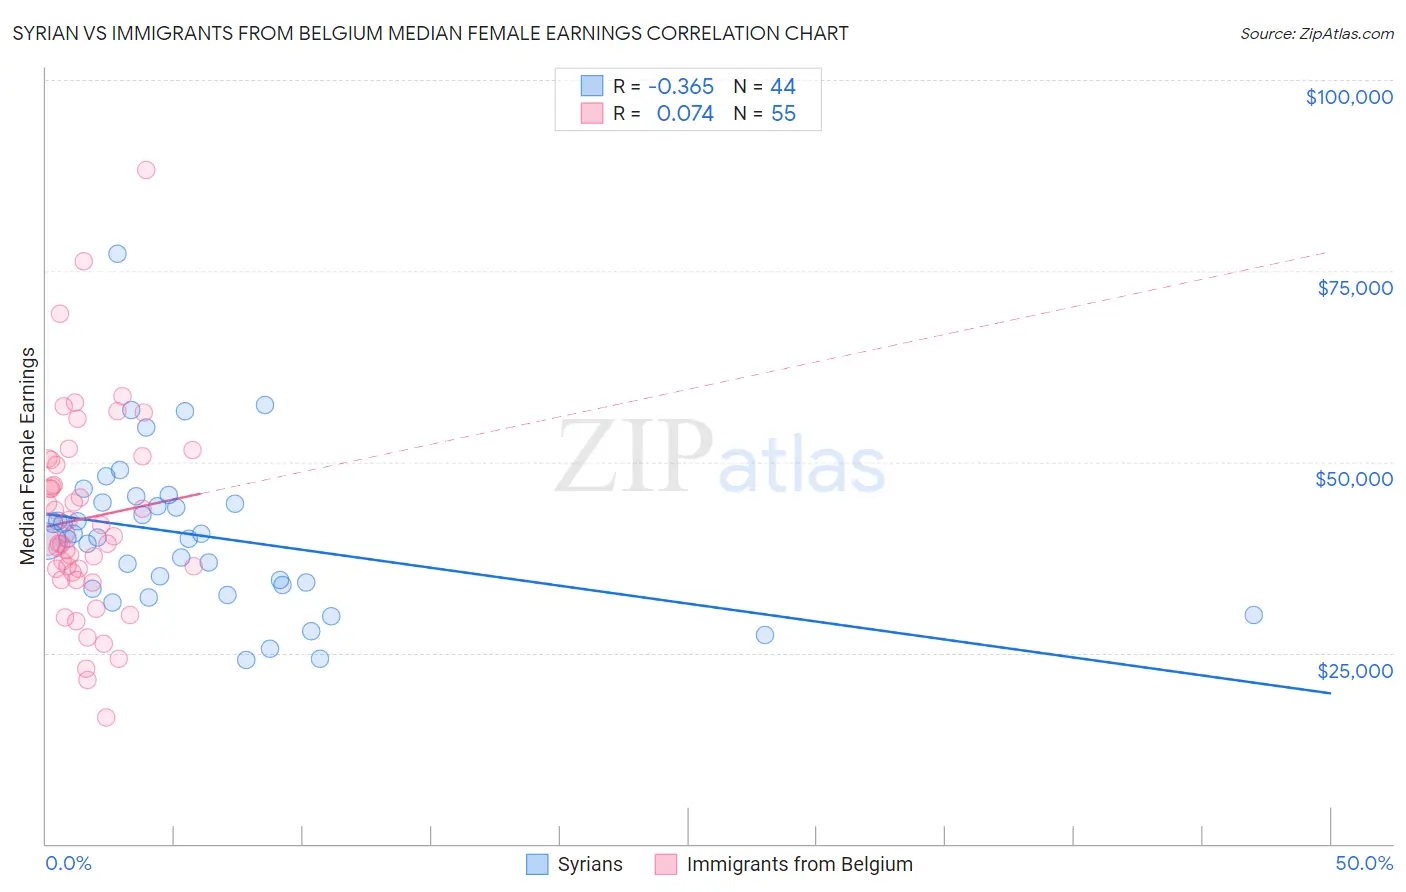
Syrian vs Immigrants from Belgium Median Female Earnings Correlation Chart
The statistical analysis conducted on geographies consisting of 266,269,778 people shows a mild negative correlation between the proportion of Syrians and median female earnings in the United States with a correlation coefficient (R) of -0.365 and weighted average of $40,727. Similarly, the statistical analysis conducted on geographies consisting of 146,688,407 people shows a slight positive correlation between the proportion of Immigrants from Belgium and median female earnings in the United States with a correlation coefficient (R) of 0.074 and weighted average of $44,587, a difference of 9.5%.
Median Female Earnings Correlation Summary
| Measurement | Syrian | Immigrants from Belgium |
| Minimum | $24,091 | $16,513 |
| Maximum | $77,272 | $88,194 |
| Range | $53,181 | $71,681 |
| Mean | $40,309 | $42,604 |
| Median | $40,077 | $40,333 |
| Interquartile 25% (IQ1) | $33,656 | $35,589 |
| Interquartile 75% (IQ3) | $44,570 | $50,235 |
| Interquartile Range (IQR) | $10,914 | $14,647 |
| Standard Deviation (Sample) | $10,141 | $13,110 |
| Standard Deviation (Population) | $10,025 | $12,990 |
Similar Demographics by Median Female Earnings
Demographics Similar to Syrians by Median Female Earnings
In terms of median female earnings, the demographic groups most similar to Syrians are Arab ($40,718, a difference of 0.020%), Immigrants from Uganda ($40,739, a difference of 0.030%), Immigrants from Nepal ($40,704, a difference of 0.060%), Chilean ($40,757, a difference of 0.070%), and Immigrants from Guyana ($40,773, a difference of 0.11%).
| Demographics | Rating | Rank | Median Female Earnings |
| Immigrants | Trinidad and Tobago | 92.3 /100 | #126 | Exceptional $40,895 |
| Ugandans | 92.2 /100 | #127 | Exceptional $40,889 |
| Carpatho Rusyns | 91.2 /100 | #128 | Exceptional $40,825 |
| Zimbabweans | 90.8 /100 | #129 | Exceptional $40,798 |
| Immigrants | Guyana | 90.3 /100 | #130 | Exceptional $40,773 |
| Chileans | 90.0 /100 | #131 | Exceptional $40,757 |
| Immigrants | Uganda | 89.7 /100 | #132 | Excellent $40,739 |
| Syrians | 89.5 /100 | #133 | Excellent $40,727 |
| Arabs | 89.3 /100 | #134 | Excellent $40,718 |
| Immigrants | Nepal | 89.0 /100 | #135 | Excellent $40,704 |
| Immigrants | Eastern Africa | 87.7 /100 | #136 | Excellent $40,644 |
| Pakistanis | 86.6 /100 | #137 | Excellent $40,596 |
| Taiwanese | 86.1 /100 | #138 | Excellent $40,576 |
| Immigrants | South Eastern Asia | 85.7 /100 | #139 | Excellent $40,558 |
| Serbians | 85.2 /100 | #140 | Excellent $40,539 |
Demographics Similar to Immigrants from Belgium by Median Female Earnings
In terms of median female earnings, the demographic groups most similar to Immigrants from Belgium are Asian ($44,586, a difference of 0.0%), Immigrants from France ($44,541, a difference of 0.10%), Immigrants from Russia ($44,680, a difference of 0.21%), Turkish ($44,695, a difference of 0.24%), and Immigrants from Belarus ($44,757, a difference of 0.38%).
| Demographics | Rating | Rank | Median Female Earnings |
| Immigrants | Greece | 100.0 /100 | #22 | Exceptional $44,976 |
| Burmese | 100.0 /100 | #23 | Exceptional $44,911 |
| Immigrants | Korea | 100.0 /100 | #24 | Exceptional $44,847 |
| Immigrants | Sweden | 100.0 /100 | #25 | Exceptional $44,774 |
| Immigrants | Belarus | 100.0 /100 | #26 | Exceptional $44,757 |
| Turks | 100.0 /100 | #27 | Exceptional $44,695 |
| Immigrants | Russia | 100.0 /100 | #28 | Exceptional $44,680 |
| Immigrants | Belgium | 100.0 /100 | #29 | Exceptional $44,587 |
| Asians | 100.0 /100 | #30 | Exceptional $44,586 |
| Immigrants | France | 100.0 /100 | #31 | Exceptional $44,541 |
| Immigrants | Northern Europe | 100.0 /100 | #32 | Exceptional $44,366 |
| Immigrants | Asia | 100.0 /100 | #33 | Exceptional $44,198 |
| Russians | 100.0 /100 | #34 | Exceptional $44,169 |
| Immigrants | Sri Lanka | 100.0 /100 | #35 | Exceptional $44,161 |
| Immigrants | Turkey | 100.0 /100 | #36 | Exceptional $44,066 |