Syrian vs Immigrants from Africa Median Female Earnings
COMPARE
Syrian
Immigrants from Africa
Median Female Earnings
Median Female Earnings Comparison
Syrians
Immigrants from Africa
$40,727
MEDIAN FEMALE EARNINGS
89.5/ 100
METRIC RATING
133rd/ 347
METRIC RANK
$40,257
MEDIAN FEMALE EARNINGS
76.2/ 100
METRIC RATING
155th/ 347
METRIC RANK
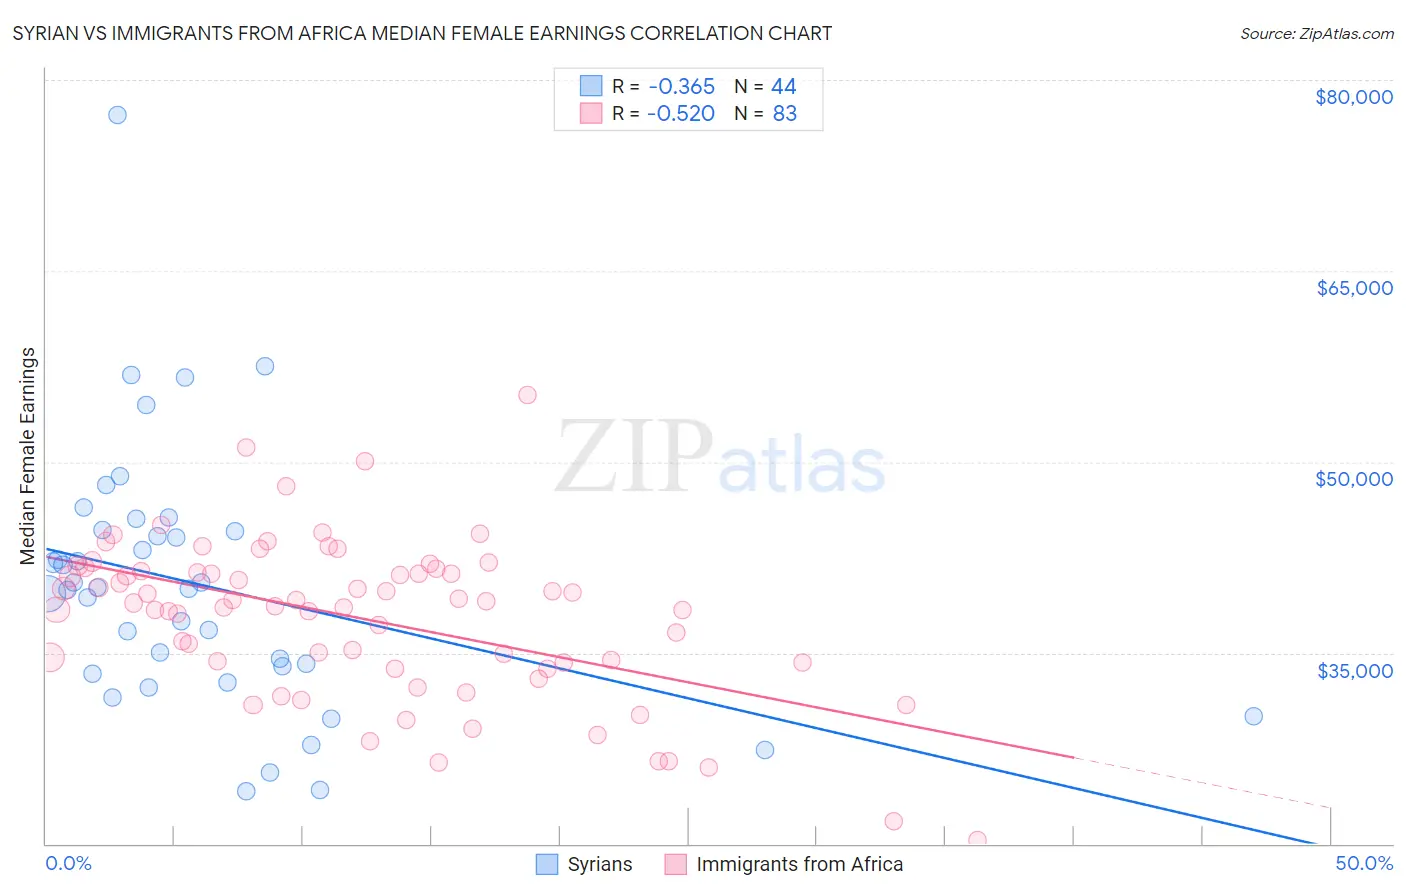
Syrian vs Immigrants from Africa Median Female Earnings Correlation Chart
The statistical analysis conducted on geographies consisting of 266,269,778 people shows a mild negative correlation between the proportion of Syrians and median female earnings in the United States with a correlation coefficient (R) of -0.365 and weighted average of $40,727. Similarly, the statistical analysis conducted on geographies consisting of 469,175,130 people shows a substantial negative correlation between the proportion of Immigrants from Africa and median female earnings in the United States with a correlation coefficient (R) of -0.520 and weighted average of $40,257, a difference of 1.2%.
Median Female Earnings Correlation Summary
| Measurement | Syrian | Immigrants from Africa |
| Minimum | $24,091 | $20,281 |
| Maximum | $77,272 | $55,224 |
| Range | $53,181 | $34,943 |
| Mean | $40,309 | $37,710 |
| Median | $40,077 | $38,916 |
| Interquartile 25% (IQ1) | $33,656 | $34,205 |
| Interquartile 75% (IQ3) | $44,570 | $41,443 |
| Interquartile Range (IQR) | $10,914 | $7,238 |
| Standard Deviation (Sample) | $10,141 | $6,266 |
| Standard Deviation (Population) | $10,025 | $6,228 |
Similar Demographics by Median Female Earnings
Demographics Similar to Syrians by Median Female Earnings
In terms of median female earnings, the demographic groups most similar to Syrians are Arab ($40,718, a difference of 0.020%), Immigrants from Uganda ($40,739, a difference of 0.030%), Immigrants from Nepal ($40,704, a difference of 0.060%), Chilean ($40,757, a difference of 0.070%), and Immigrants from Guyana ($40,773, a difference of 0.11%).
| Demographics | Rating | Rank | Median Female Earnings |
| Immigrants | Trinidad and Tobago | 92.3 /100 | #126 | Exceptional $40,895 |
| Ugandans | 92.2 /100 | #127 | Exceptional $40,889 |
| Carpatho Rusyns | 91.2 /100 | #128 | Exceptional $40,825 |
| Zimbabweans | 90.8 /100 | #129 | Exceptional $40,798 |
| Immigrants | Guyana | 90.3 /100 | #130 | Exceptional $40,773 |
| Chileans | 90.0 /100 | #131 | Exceptional $40,757 |
| Immigrants | Uganda | 89.7 /100 | #132 | Excellent $40,739 |
| Syrians | 89.5 /100 | #133 | Excellent $40,727 |
| Arabs | 89.3 /100 | #134 | Excellent $40,718 |
| Immigrants | Nepal | 89.0 /100 | #135 | Excellent $40,704 |
| Immigrants | Eastern Africa | 87.7 /100 | #136 | Excellent $40,644 |
| Pakistanis | 86.6 /100 | #137 | Excellent $40,596 |
| Taiwanese | 86.1 /100 | #138 | Excellent $40,576 |
| Immigrants | South Eastern Asia | 85.7 /100 | #139 | Excellent $40,558 |
| Serbians | 85.2 /100 | #140 | Excellent $40,539 |
Demographics Similar to Immigrants from Africa by Median Female Earnings
In terms of median female earnings, the demographic groups most similar to Immigrants from Africa are Peruvian ($40,234, a difference of 0.060%), British West Indian ($40,299, a difference of 0.10%), Immigrants from Oceania ($40,297, a difference of 0.10%), West Indian ($40,317, a difference of 0.15%), and Portuguese ($40,177, a difference of 0.20%).
| Demographics | Rating | Rank | Median Female Earnings |
| Poles | 80.2 /100 | #148 | Excellent $40,371 |
| Immigrants | Cameroon | 79.7 /100 | #149 | Good $40,354 |
| Immigrants | Chile | 79.6 /100 | #150 | Good $40,353 |
| Immigrants | Armenia | 79.2 /100 | #151 | Good $40,340 |
| West Indians | 78.4 /100 | #152 | Good $40,317 |
| British West Indians | 77.7 /100 | #153 | Good $40,299 |
| Immigrants | Oceania | 77.6 /100 | #154 | Good $40,297 |
| Immigrants | Africa | 76.2 /100 | #155 | Good $40,257 |
| Peruvians | 75.3 /100 | #156 | Good $40,234 |
| Portuguese | 73.0 /100 | #157 | Good $40,177 |
| Immigrants | Senegal | 72.2 /100 | #158 | Good $40,157 |
| Immigrants | Vietnam | 72.0 /100 | #159 | Good $40,153 |
| Inupiat | 68.9 /100 | #160 | Good $40,080 |
| Alsatians | 68.0 /100 | #161 | Good $40,060 |
| South American Indians | 66.1 /100 | #162 | Good $40,019 |