Syrian vs Hmong 2nd Grade
COMPARE
Syrian
Hmong
2nd Grade
2nd Grade Comparison
Syrians
Hmong
98.1%
2ND GRADE
94.0/ 100
METRIC RATING
126th/ 347
METRIC RANK
98.0%
2ND GRADE
80.0/ 100
METRIC RATING
144th/ 347
METRIC RANK
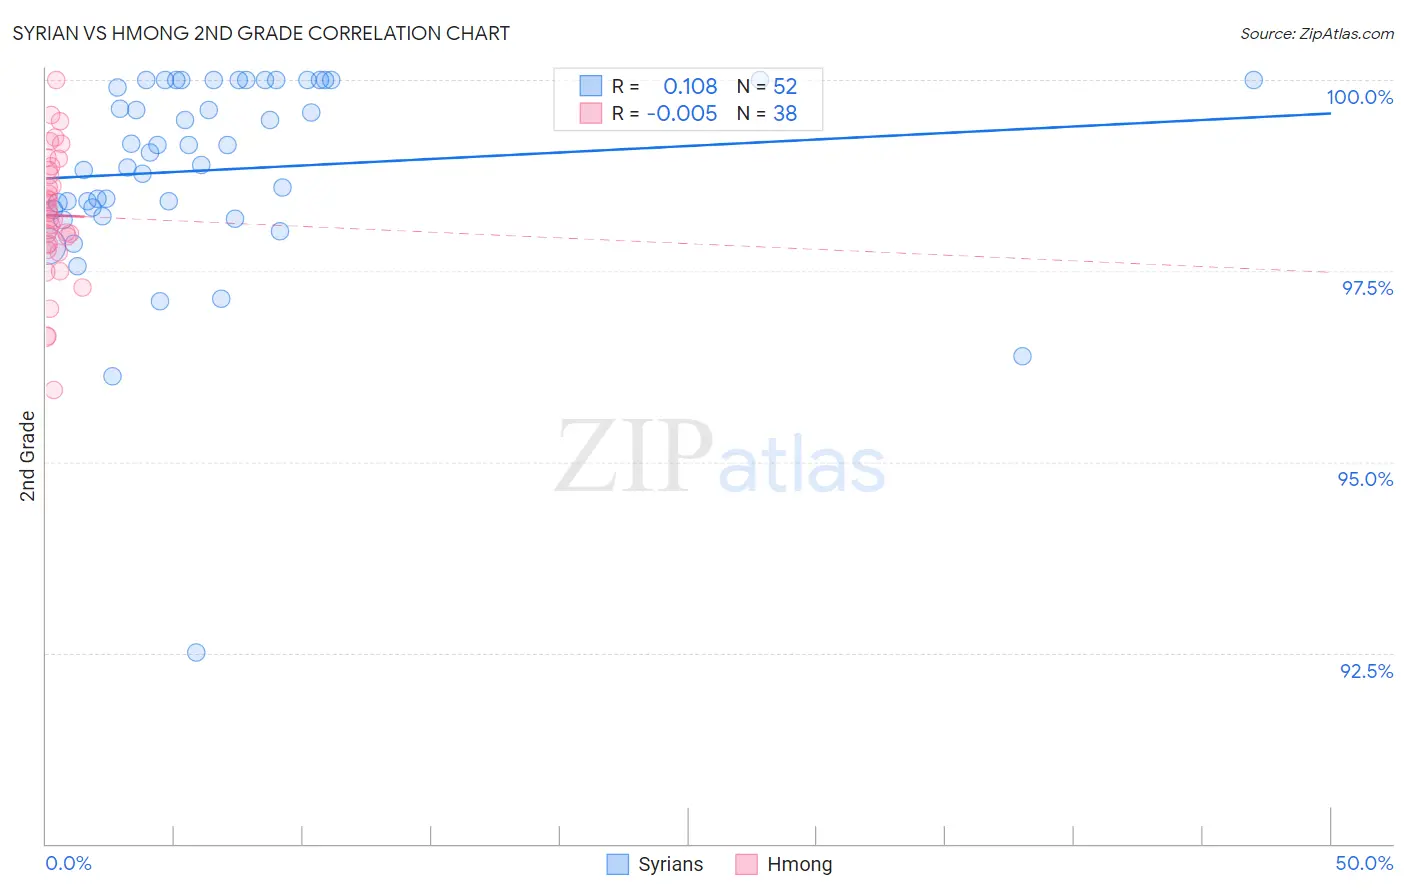
Syrian vs Hmong 2nd Grade Correlation Chart
The statistical analysis conducted on geographies consisting of 266,305,988 people shows a poor positive correlation between the proportion of Syrians and percentage of population with at least 2nd grade education in the United States with a correlation coefficient (R) of 0.108 and weighted average of 98.1%. Similarly, the statistical analysis conducted on geographies consisting of 24,672,093 people shows no correlation between the proportion of Hmong and percentage of population with at least 2nd grade education in the United States with a correlation coefficient (R) of -0.005 and weighted average of 98.0%, a difference of 0.11%.
2nd Grade Correlation Summary
| Measurement | Syrian | Hmong |
| Minimum | 92.5% | 95.9% |
| Maximum | 100.0% | 100.0% |
| Range | 7.5% | 4.1% |
| Mean | 98.8% | 98.2% |
| Median | 99.1% | 98.2% |
| Interquartile 25% (IQ1) | 98.3% | 97.8% |
| Interquartile 75% (IQ3) | 100.0% | 98.8% |
| Interquartile Range (IQR) | 1.7% | 0.98% |
| Standard Deviation (Sample) | 1.3% | 0.85% |
| Standard Deviation (Population) | 1.3% | 0.84% |
Demographics Similar to Syrians and Hmong by 2nd Grade
In terms of 2nd grade, the demographic groups most similar to Syrians are Iroquois (98.1%, a difference of 0.0%), Immigrants from Saudi Arabia (98.1%, a difference of 0.010%), Immigrants from Serbia (98.1%, a difference of 0.020%), Immigrants from Croatia (98.1%, a difference of 0.020%), and Seminole (98.0%, a difference of 0.030%). Similarly, the demographic groups most similar to Hmong are Alsatian (98.0%, a difference of 0.0%), Filipino (98.0%, a difference of 0.0%), Burmese (98.0%, a difference of 0.010%), Palestinian (98.0%, a difference of 0.020%), and Immigrants from Turkey (98.0%, a difference of 0.020%).
| Demographics | Rating | Rank | 2nd Grade |
| Iroquois | 94.1 /100 | #125 | Exceptional 98.1% |
| Syrians | 94.0 /100 | #126 | Exceptional 98.1% |
| Immigrants | Saudi Arabia | 93.6 /100 | #127 | Exceptional 98.1% |
| Immigrants | Serbia | 92.3 /100 | #128 | Exceptional 98.1% |
| Immigrants | Croatia | 92.1 /100 | #129 | Exceptional 98.1% |
| Seminole | 91.1 /100 | #130 | Exceptional 98.0% |
| Immigrants | Europe | 91.1 /100 | #131 | Exceptional 98.0% |
| Spaniards | 90.7 /100 | #132 | Exceptional 98.0% |
| Cambodians | 90.7 /100 | #133 | Exceptional 98.0% |
| Immigrants | Hungary | 89.7 /100 | #134 | Excellent 98.0% |
| Immigrants | Bulgaria | 89.7 /100 | #135 | Excellent 98.0% |
| Immigrants | Kuwait | 89.2 /100 | #136 | Excellent 98.0% |
| Immigrants | Romania | 88.3 /100 | #137 | Excellent 98.0% |
| Israelis | 87.9 /100 | #138 | Excellent 98.0% |
| Blackfeet | 87.5 /100 | #139 | Excellent 98.0% |
| Palestinians | 83.9 /100 | #140 | Excellent 98.0% |
| Immigrants | Turkey | 83.0 /100 | #141 | Excellent 98.0% |
| Burmese | 81.0 /100 | #142 | Excellent 98.0% |
| Alsatians | 80.5 /100 | #143 | Excellent 98.0% |
| Hmong | 80.0 /100 | #144 | Good 98.0% |
| Filipinos | 79.2 /100 | #145 | Good 98.0% |