Syrian vs Immigrants from Chile Median Female Earnings
COMPARE
Syrian
Immigrants from Chile
Median Female Earnings
Median Female Earnings Comparison
Syrians
Immigrants from Chile
$40,727
MEDIAN FEMALE EARNINGS
89.5/ 100
METRIC RATING
133rd/ 347
METRIC RANK
$40,353
MEDIAN FEMALE EARNINGS
79.6/ 100
METRIC RATING
150th/ 347
METRIC RANK
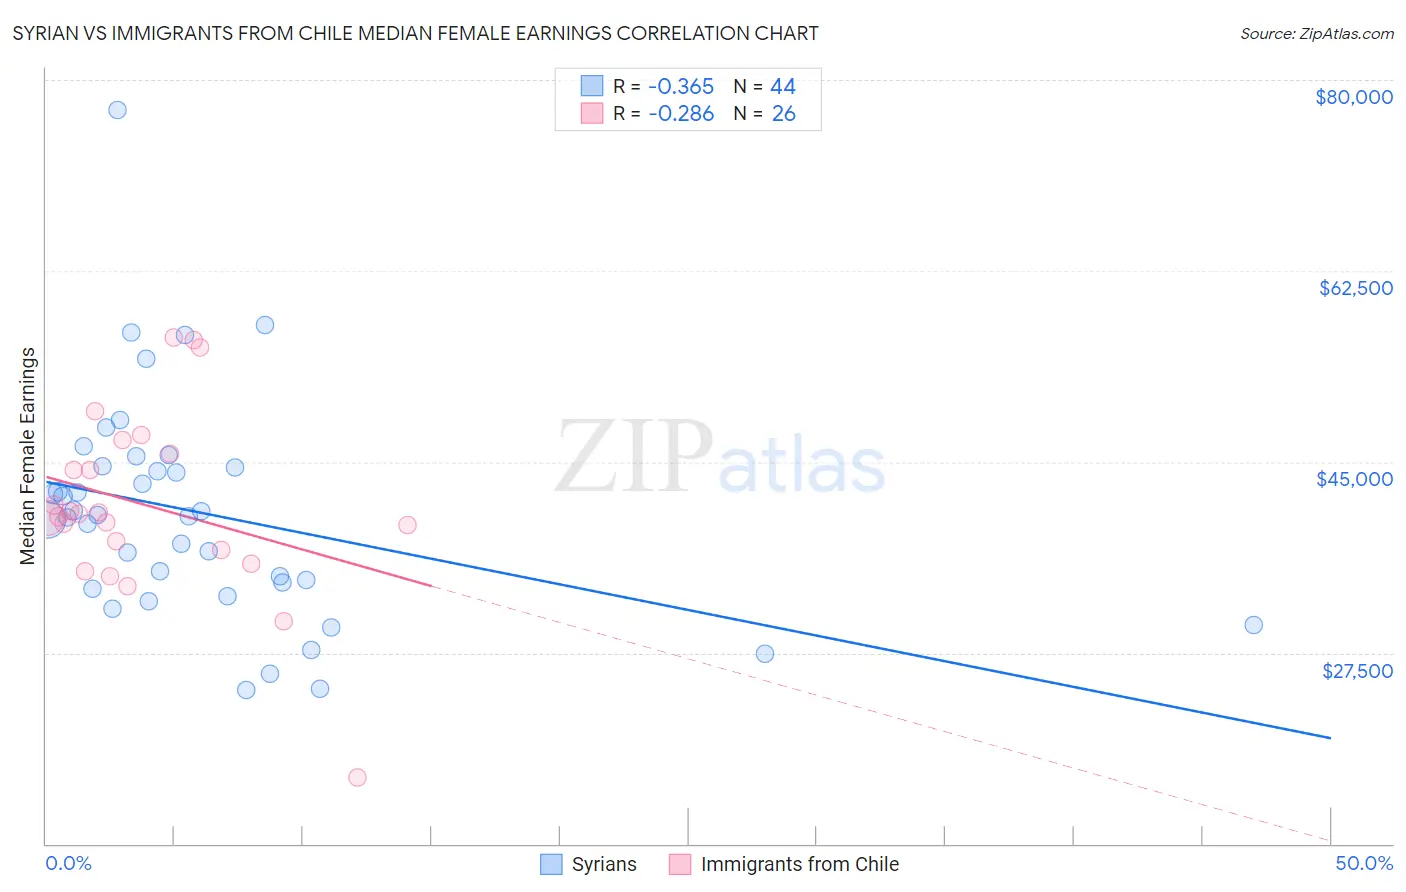
Syrian vs Immigrants from Chile Median Female Earnings Correlation Chart
The statistical analysis conducted on geographies consisting of 266,269,778 people shows a mild negative correlation between the proportion of Syrians and median female earnings in the United States with a correlation coefficient (R) of -0.365 and weighted average of $40,727. Similarly, the statistical analysis conducted on geographies consisting of 218,612,520 people shows a weak negative correlation between the proportion of Immigrants from Chile and median female earnings in the United States with a correlation coefficient (R) of -0.286 and weighted average of $40,353, a difference of 0.93%.
Median Female Earnings Correlation Summary
| Measurement | Syrian | Immigrants from Chile |
| Minimum | $24,091 | $16,042 |
| Maximum | $77,272 | $56,442 |
| Range | $53,181 | $40,400 |
| Mean | $40,309 | $41,031 |
| Median | $40,077 | $40,109 |
| Interquartile 25% (IQ1) | $33,656 | $36,875 |
| Interquartile 75% (IQ3) | $44,570 | $45,789 |
| Interquartile Range (IQR) | $10,914 | $8,914 |
| Standard Deviation (Sample) | $10,141 | $8,520 |
| Standard Deviation (Population) | $10,025 | $8,355 |
Demographics Similar to Syrians and Immigrants from Chile by Median Female Earnings
In terms of median female earnings, the demographic groups most similar to Syrians are Arab ($40,718, a difference of 0.020%), Immigrants from Uganda ($40,739, a difference of 0.030%), Immigrants from Nepal ($40,704, a difference of 0.060%), Chilean ($40,757, a difference of 0.070%), and Immigrants from Eastern Africa ($40,644, a difference of 0.20%). Similarly, the demographic groups most similar to Immigrants from Chile are Immigrants from Cameroon ($40,354, a difference of 0.0%), Immigrants from Armenia ($40,340, a difference of 0.030%), Polish ($40,371, a difference of 0.040%), Vietnamese ($40,377, a difference of 0.060%), and Ghanaian ($40,429, a difference of 0.19%).
| Demographics | Rating | Rank | Median Female Earnings |
| Chileans | 90.0 /100 | #131 | Exceptional $40,757 |
| Immigrants | Uganda | 89.7 /100 | #132 | Excellent $40,739 |
| Syrians | 89.5 /100 | #133 | Excellent $40,727 |
| Arabs | 89.3 /100 | #134 | Excellent $40,718 |
| Immigrants | Nepal | 89.0 /100 | #135 | Excellent $40,704 |
| Immigrants | Eastern Africa | 87.7 /100 | #136 | Excellent $40,644 |
| Pakistanis | 86.6 /100 | #137 | Excellent $40,596 |
| Taiwanese | 86.1 /100 | #138 | Excellent $40,576 |
| Immigrants | South Eastern Asia | 85.7 /100 | #139 | Excellent $40,558 |
| Serbians | 85.2 /100 | #140 | Excellent $40,539 |
| Immigrants | Syria | 84.1 /100 | #141 | Excellent $40,499 |
| Sri Lankans | 84.0 /100 | #142 | Excellent $40,496 |
| Northern Europeans | 83.9 /100 | #143 | Excellent $40,491 |
| Immigrants | North Macedonia | 83.8 /100 | #144 | Excellent $40,488 |
| Brazilians | 83.6 /100 | #145 | Excellent $40,483 |
| Ghanaians | 82.1 /100 | #146 | Excellent $40,429 |
| Vietnamese | 80.4 /100 | #147 | Excellent $40,377 |
| Poles | 80.2 /100 | #148 | Excellent $40,371 |
| Immigrants | Cameroon | 79.7 /100 | #149 | Good $40,354 |
| Immigrants | Chile | 79.6 /100 | #150 | Good $40,353 |
| Immigrants | Armenia | 79.2 /100 | #151 | Good $40,340 |