Syrian vs Immigrants from Argentina Median Female Earnings
COMPARE
Syrian
Immigrants from Argentina
Median Female Earnings
Median Female Earnings Comparison
Syrians
Immigrants from Argentina
$40,727
MEDIAN FEMALE EARNINGS
89.5/ 100
METRIC RATING
133rd/ 347
METRIC RANK
$41,554
MEDIAN FEMALE EARNINGS
97.9/ 100
METRIC RATING
103rd/ 347
METRIC RANK
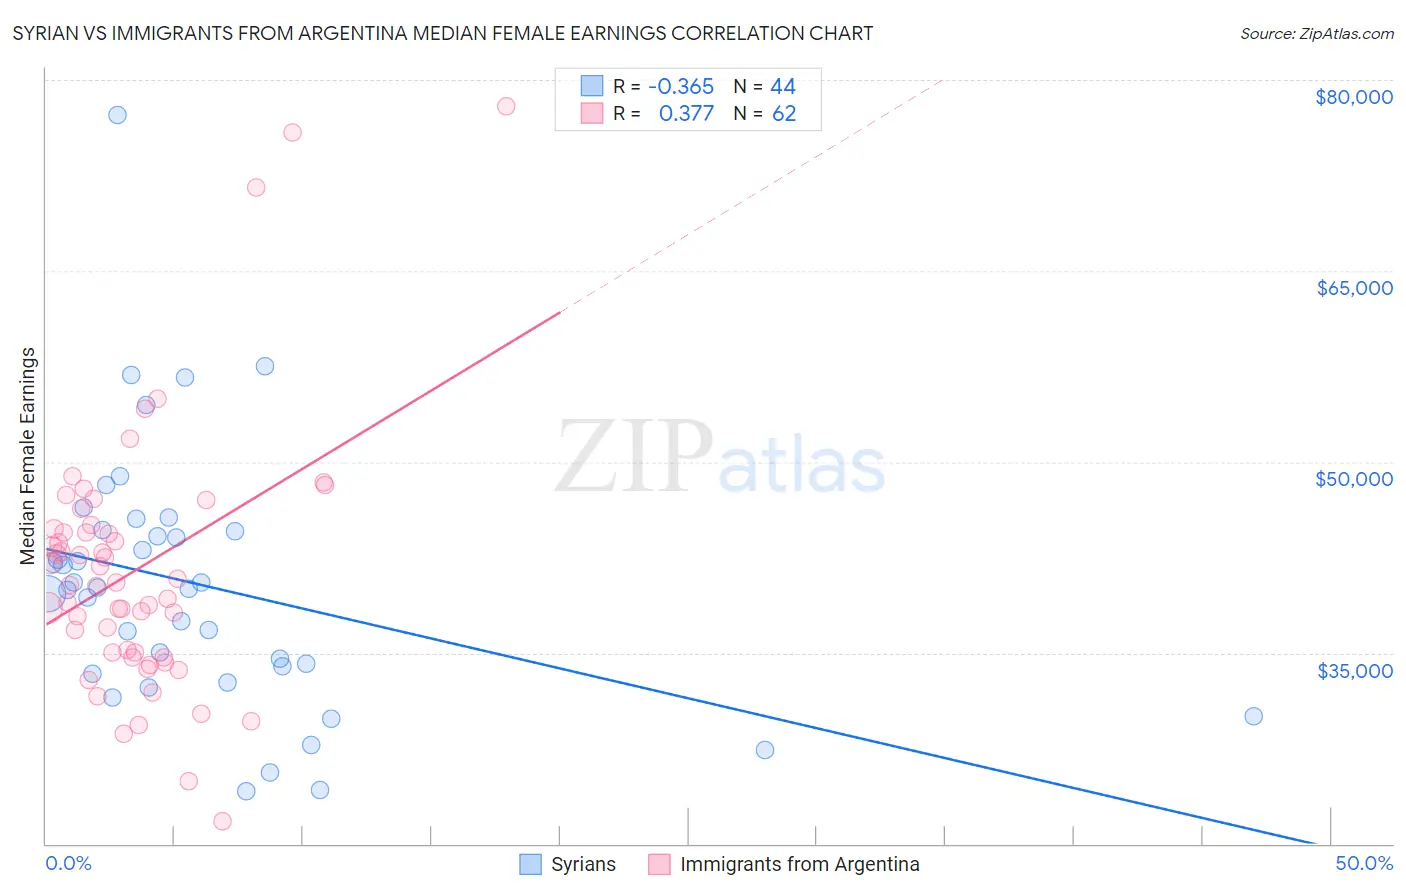
Syrian vs Immigrants from Argentina Median Female Earnings Correlation Chart
The statistical analysis conducted on geographies consisting of 266,269,778 people shows a mild negative correlation between the proportion of Syrians and median female earnings in the United States with a correlation coefficient (R) of -0.365 and weighted average of $40,727. Similarly, the statistical analysis conducted on geographies consisting of 264,373,843 people shows a mild positive correlation between the proportion of Immigrants from Argentina and median female earnings in the United States with a correlation coefficient (R) of 0.377 and weighted average of $41,554, a difference of 2.0%.
Median Female Earnings Correlation Summary
| Measurement | Syrian | Immigrants from Argentina |
| Minimum | $24,091 | $21,743 |
| Maximum | $77,272 | $77,902 |
| Range | $53,181 | $56,159 |
| Mean | $40,309 | $41,489 |
| Median | $40,077 | $40,427 |
| Interquartile 25% (IQ1) | $33,656 | $34,985 |
| Interquartile 75% (IQ3) | $44,570 | $44,732 |
| Interquartile Range (IQR) | $10,914 | $9,747 |
| Standard Deviation (Sample) | $10,141 | $10,181 |
| Standard Deviation (Population) | $10,025 | $10,099 |
Similar Demographics by Median Female Earnings
Demographics Similar to Syrians by Median Female Earnings
In terms of median female earnings, the demographic groups most similar to Syrians are Arab ($40,718, a difference of 0.020%), Immigrants from Uganda ($40,739, a difference of 0.030%), Immigrants from Nepal ($40,704, a difference of 0.060%), Chilean ($40,757, a difference of 0.070%), and Immigrants from Guyana ($40,773, a difference of 0.11%).
| Demographics | Rating | Rank | Median Female Earnings |
| Immigrants | Trinidad and Tobago | 92.3 /100 | #126 | Exceptional $40,895 |
| Ugandans | 92.2 /100 | #127 | Exceptional $40,889 |
| Carpatho Rusyns | 91.2 /100 | #128 | Exceptional $40,825 |
| Zimbabweans | 90.8 /100 | #129 | Exceptional $40,798 |
| Immigrants | Guyana | 90.3 /100 | #130 | Exceptional $40,773 |
| Chileans | 90.0 /100 | #131 | Exceptional $40,757 |
| Immigrants | Uganda | 89.7 /100 | #132 | Excellent $40,739 |
| Syrians | 89.5 /100 | #133 | Excellent $40,727 |
| Arabs | 89.3 /100 | #134 | Excellent $40,718 |
| Immigrants | Nepal | 89.0 /100 | #135 | Excellent $40,704 |
| Immigrants | Eastern Africa | 87.7 /100 | #136 | Excellent $40,644 |
| Pakistanis | 86.6 /100 | #137 | Excellent $40,596 |
| Taiwanese | 86.1 /100 | #138 | Excellent $40,576 |
| Immigrants | South Eastern Asia | 85.7 /100 | #139 | Excellent $40,558 |
| Serbians | 85.2 /100 | #140 | Excellent $40,539 |
Demographics Similar to Immigrants from Argentina by Median Female Earnings
In terms of median female earnings, the demographic groups most similar to Immigrants from Argentina are Immigrants from Zimbabwe ($41,527, a difference of 0.060%), Italian ($41,505, a difference of 0.12%), Immigrants from Eritrea ($41,485, a difference of 0.17%), Palestinian ($41,484, a difference of 0.17%), and Immigrants from Poland ($41,630, a difference of 0.18%).
| Demographics | Rating | Rank | Median Female Earnings |
| South Africans | 98.8 /100 | #96 | Exceptional $41,825 |
| Immigrants | Hungary | 98.8 /100 | #97 | Exceptional $41,820 |
| Immigrants | Scotland | 98.7 /100 | #98 | Exceptional $41,771 |
| Immigrants | Barbados | 98.4 /100 | #99 | Exceptional $41,685 |
| Romanians | 98.3 /100 | #100 | Exceptional $41,663 |
| Immigrants | Fiji | 98.3 /100 | #101 | Exceptional $41,656 |
| Immigrants | Poland | 98.2 /100 | #102 | Exceptional $41,630 |
| Immigrants | Argentina | 97.9 /100 | #103 | Exceptional $41,554 |
| Immigrants | Zimbabwe | 97.8 /100 | #104 | Exceptional $41,527 |
| Italians | 97.7 /100 | #105 | Exceptional $41,505 |
| Immigrants | Eritrea | 97.6 /100 | #106 | Exceptional $41,485 |
| Palestinians | 97.6 /100 | #107 | Exceptional $41,484 |
| Jordanians | 97.5 /100 | #108 | Exceptional $41,464 |
| Chinese | 97.5 /100 | #109 | Exceptional $41,461 |
| Immigrants | Western Asia | 97.0 /100 | #110 | Exceptional $41,375 |