Syrian vs Hmong Bachelor's Degree
COMPARE
Syrian
Hmong
Bachelor's Degree
Bachelor's Degree Comparison
Syrians
Hmong
41.1%
BACHELOR'S DEGREE
97.4/ 100
METRIC RATING
105th/ 347
METRIC RANK
34.8%
BACHELOR'S DEGREE
3.4/ 100
METRIC RATING
232nd/ 347
METRIC RANK
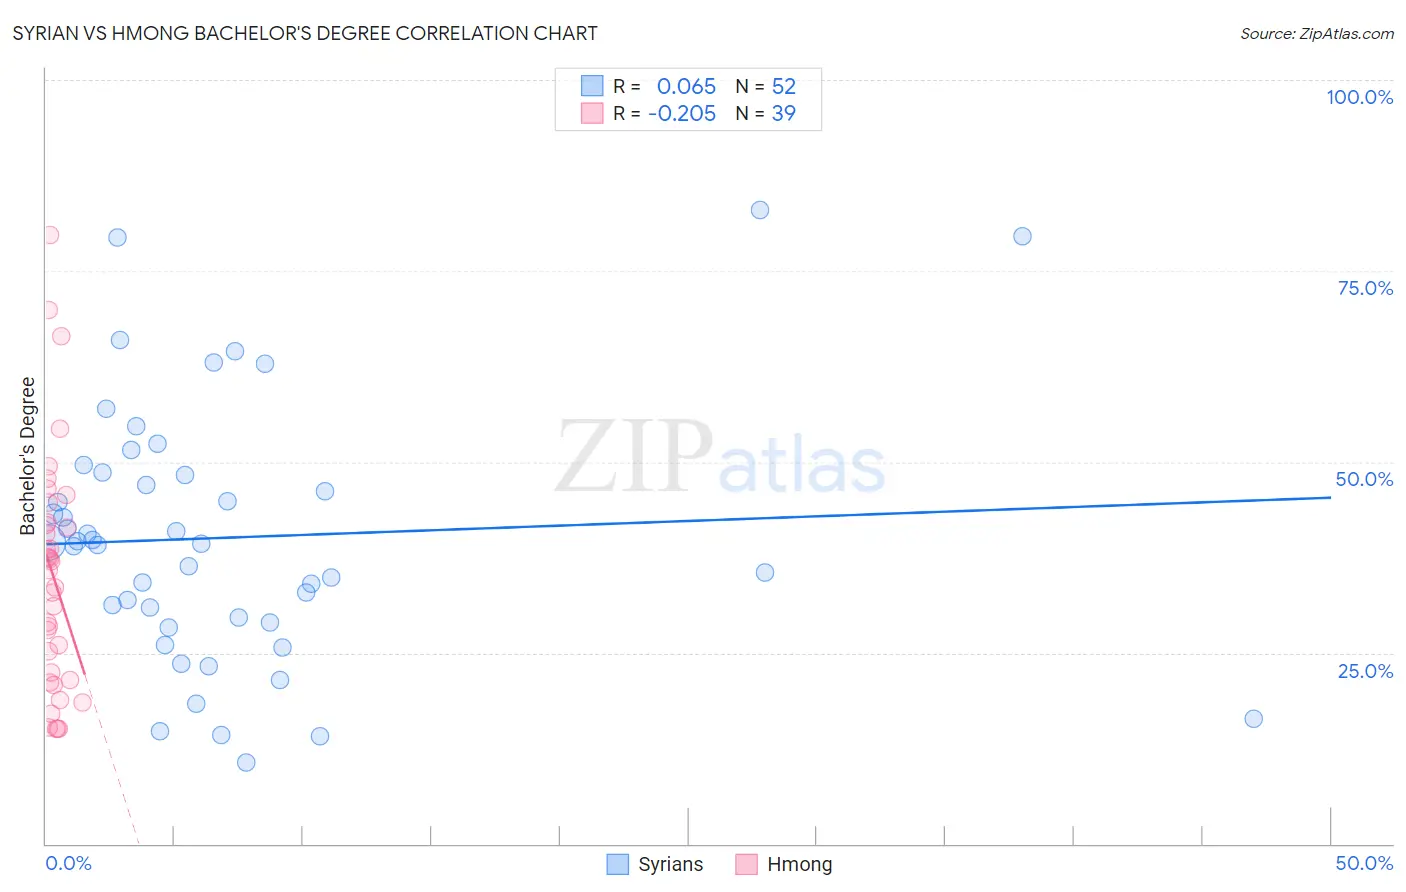
Syrian vs Hmong Bachelor's Degree Correlation Chart
The statistical analysis conducted on geographies consisting of 266,300,511 people shows a slight positive correlation between the proportion of Syrians and percentage of population with at least bachelor's degree education in the United States with a correlation coefficient (R) of 0.065 and weighted average of 41.1%. Similarly, the statistical analysis conducted on geographies consisting of 24,680,511 people shows a weak negative correlation between the proportion of Hmong and percentage of population with at least bachelor's degree education in the United States with a correlation coefficient (R) of -0.205 and weighted average of 34.8%, a difference of 18.4%.
Bachelor's Degree Correlation Summary
| Measurement | Syrian | Hmong |
| Minimum | 10.6% | 15.0% |
| Maximum | 83.0% | 79.7% |
| Range | 72.4% | 64.7% |
| Mean | 40.1% | 35.0% |
| Median | 39.4% | 35.8% |
| Interquartile 25% (IQ1) | 29.4% | 21.5% |
| Interquartile 75% (IQ3) | 48.4% | 42.0% |
| Interquartile Range (IQR) | 19.1% | 20.5% |
| Standard Deviation (Sample) | 16.8% | 15.4% |
| Standard Deviation (Population) | 16.6% | 15.2% |
Similar Demographics by Bachelor's Degree
Demographics Similar to Syrians by Bachelor's Degree
In terms of bachelor's degree, the demographic groups most similar to Syrians are Jordanian (41.2%, a difference of 0.030%), Chilean (41.2%, a difference of 0.090%), Alsatian (41.0%, a difference of 0.26%), Immigrants from Italy (41.3%, a difference of 0.43%), and Northern European (41.0%, a difference of 0.43%).
| Demographics | Rating | Rank | Bachelor's Degree |
| Immigrants | Ukraine | 98.3 /100 | #98 | Exceptional 41.5% |
| Immigrants | England | 98.1 /100 | #99 | Exceptional 41.4% |
| Macedonians | 98.1 /100 | #100 | Exceptional 41.4% |
| Immigrants | Morocco | 98.0 /100 | #101 | Exceptional 41.4% |
| Immigrants | Italy | 97.8 /100 | #102 | Exceptional 41.3% |
| Chileans | 97.5 /100 | #103 | Exceptional 41.2% |
| Jordanians | 97.4 /100 | #104 | Exceptional 41.2% |
| Syrians | 97.4 /100 | #105 | Exceptional 41.1% |
| Alsatians | 97.0 /100 | #106 | Exceptional 41.0% |
| Northern Europeans | 96.8 /100 | #107 | Exceptional 41.0% |
| Ukrainians | 96.6 /100 | #108 | Exceptional 40.9% |
| Arabs | 96.6 /100 | #109 | Exceptional 40.9% |
| Albanians | 96.5 /100 | #110 | Exceptional 40.9% |
| Immigrants | Chile | 96.4 /100 | #111 | Exceptional 40.8% |
| Ugandans | 96.3 /100 | #112 | Exceptional 40.8% |
Demographics Similar to Hmong by Bachelor's Degree
In terms of bachelor's degree, the demographic groups most similar to Hmong are Immigrants from Ecuador (34.7%, a difference of 0.11%), Guamanian/Chamorro (34.6%, a difference of 0.32%), Immigrants from West Indies (34.6%, a difference of 0.42%), Liberian (34.6%, a difference of 0.52%), and Tlingit-Haida (34.6%, a difference of 0.56%).
| Demographics | Rating | Rank | Bachelor's Degree |
| Immigrants | Burma/Myanmar | 7.3 /100 | #225 | Tragic 35.5% |
| Portuguese | 7.2 /100 | #226 | Tragic 35.5% |
| Ecuadorians | 6.6 /100 | #227 | Tragic 35.4% |
| Immigrants | Trinidad and Tobago | 6.0 /100 | #228 | Tragic 35.3% |
| Whites/Caucasians | 5.9 /100 | #229 | Tragic 35.3% |
| Immigrants | Grenada | 4.3 /100 | #230 | Tragic 35.0% |
| Immigrants | St. Vincent and the Grenadines | 4.3 /100 | #231 | Tragic 35.0% |
| Hmong | 3.4 /100 | #232 | Tragic 34.8% |
| Immigrants | Ecuador | 3.3 /100 | #233 | Tragic 34.7% |
| Guamanians/Chamorros | 3.0 /100 | #234 | Tragic 34.6% |
| Immigrants | West Indies | 2.9 /100 | #235 | Tragic 34.6% |
| Liberians | 2.8 /100 | #236 | Tragic 34.6% |
| Tlingit-Haida | 2.8 /100 | #237 | Tragic 34.6% |
| Guyanese | 2.5 /100 | #238 | Tragic 34.5% |
| British West Indians | 2.5 /100 | #239 | Tragic 34.5% |