Syrian vs Immigrants from Western Europe Median Female Earnings
COMPARE
Syrian
Immigrants from Western Europe
Median Female Earnings
Median Female Earnings Comparison
Syrians
Immigrants from Western Europe
$40,727
MEDIAN FEMALE EARNINGS
89.5/ 100
METRIC RATING
133rd/ 347
METRIC RANK
$41,990
MEDIAN FEMALE EARNINGS
99.2/ 100
METRIC RATING
91st/ 347
METRIC RANK
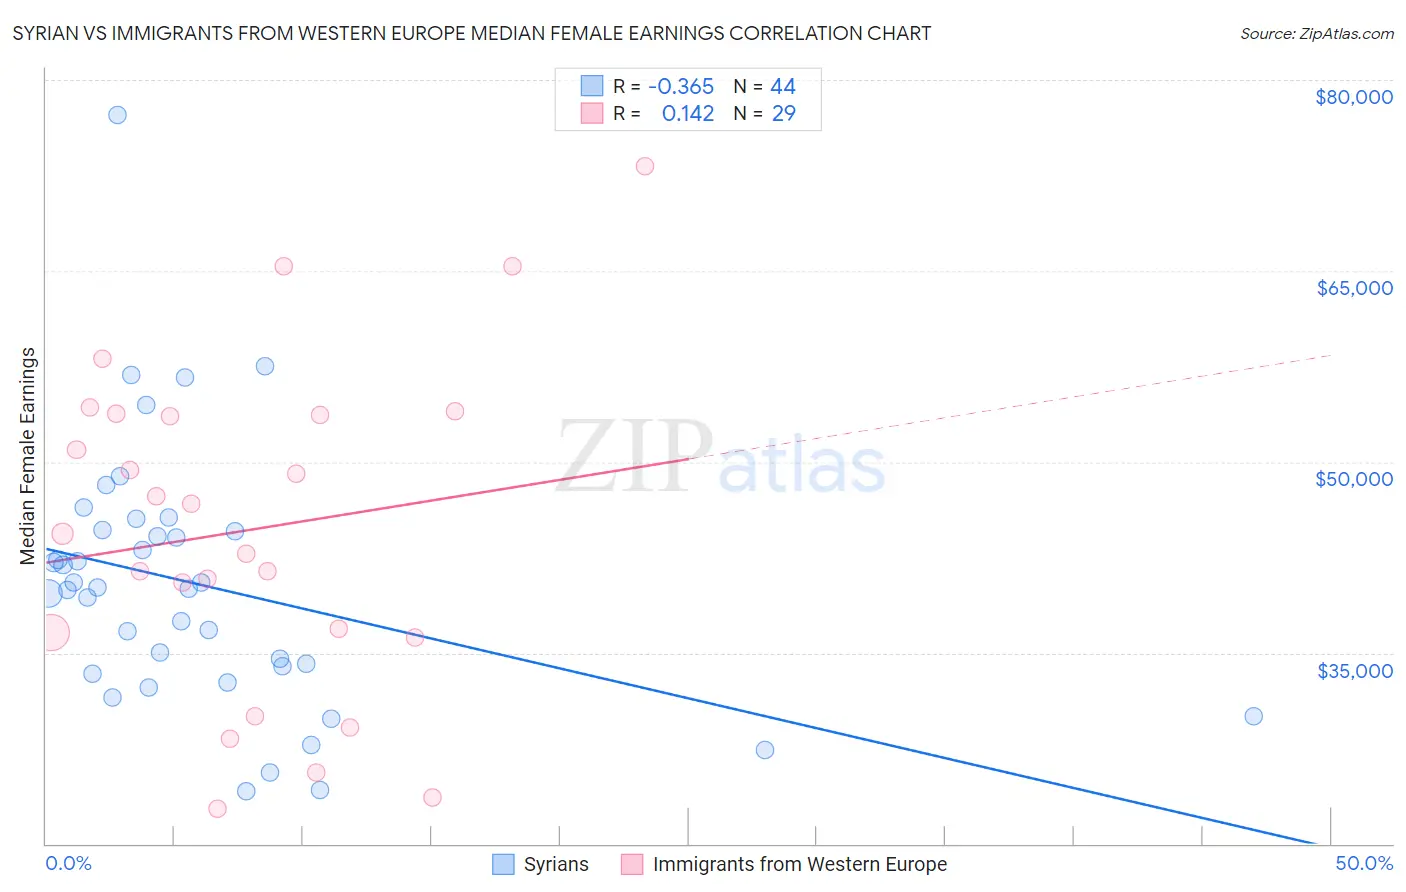
Syrian vs Immigrants from Western Europe Median Female Earnings Correlation Chart
The statistical analysis conducted on geographies consisting of 266,269,778 people shows a mild negative correlation between the proportion of Syrians and median female earnings in the United States with a correlation coefficient (R) of -0.365 and weighted average of $40,727. Similarly, the statistical analysis conducted on geographies consisting of 493,549,383 people shows a poor positive correlation between the proportion of Immigrants from Western Europe and median female earnings in the United States with a correlation coefficient (R) of 0.142 and weighted average of $41,990, a difference of 3.1%.
Median Female Earnings Correlation Summary
| Measurement | Syrian | Immigrants from Western Europe |
| Minimum | $24,091 | $22,777 |
| Maximum | $77,272 | $73,250 |
| Range | $53,181 | $50,473 |
| Mean | $40,309 | $44,663 |
| Median | $40,077 | $44,308 |
| Interquartile 25% (IQ1) | $33,656 | $36,403 |
| Interquartile 75% (IQ3) | $44,570 | $53,740 |
| Interquartile Range (IQR) | $10,914 | $17,337 |
| Standard Deviation (Sample) | $10,141 | $12,864 |
| Standard Deviation (Population) | $10,025 | $12,640 |
Similar Demographics by Median Female Earnings
Demographics Similar to Syrians by Median Female Earnings
In terms of median female earnings, the demographic groups most similar to Syrians are Arab ($40,718, a difference of 0.020%), Immigrants from Uganda ($40,739, a difference of 0.030%), Immigrants from Nepal ($40,704, a difference of 0.060%), Chilean ($40,757, a difference of 0.070%), and Immigrants from Guyana ($40,773, a difference of 0.11%).
| Demographics | Rating | Rank | Median Female Earnings |
| Immigrants | Trinidad and Tobago | 92.3 /100 | #126 | Exceptional $40,895 |
| Ugandans | 92.2 /100 | #127 | Exceptional $40,889 |
| Carpatho Rusyns | 91.2 /100 | #128 | Exceptional $40,825 |
| Zimbabweans | 90.8 /100 | #129 | Exceptional $40,798 |
| Immigrants | Guyana | 90.3 /100 | #130 | Exceptional $40,773 |
| Chileans | 90.0 /100 | #131 | Exceptional $40,757 |
| Immigrants | Uganda | 89.7 /100 | #132 | Excellent $40,739 |
| Syrians | 89.5 /100 | #133 | Excellent $40,727 |
| Arabs | 89.3 /100 | #134 | Excellent $40,718 |
| Immigrants | Nepal | 89.0 /100 | #135 | Excellent $40,704 |
| Immigrants | Eastern Africa | 87.7 /100 | #136 | Excellent $40,644 |
| Pakistanis | 86.6 /100 | #137 | Excellent $40,596 |
| Taiwanese | 86.1 /100 | #138 | Excellent $40,576 |
| Immigrants | South Eastern Asia | 85.7 /100 | #139 | Excellent $40,558 |
| Serbians | 85.2 /100 | #140 | Excellent $40,539 |
Demographics Similar to Immigrants from Western Europe by Median Female Earnings
In terms of median female earnings, the demographic groups most similar to Immigrants from Western Europe are Ukrainian ($42,015, a difference of 0.060%), Argentinean ($41,952, a difference of 0.090%), Immigrants from Grenada ($41,932, a difference of 0.14%), Immigrants from Afghanistan ($42,055, a difference of 0.15%), and Immigrants from Northern Africa ($42,084, a difference of 0.22%).
| Demographics | Rating | Rank | Median Female Earnings |
| Armenians | 99.5 /100 | #84 | Exceptional $42,212 |
| Laotians | 99.4 /100 | #85 | Exceptional $42,133 |
| Immigrants | St. Vincent and the Grenadines | 99.3 /100 | #86 | Exceptional $42,108 |
| Lithuanians | 99.3 /100 | #87 | Exceptional $42,108 |
| Immigrants | Northern Africa | 99.3 /100 | #88 | Exceptional $42,084 |
| Immigrants | Afghanistan | 99.3 /100 | #89 | Exceptional $42,055 |
| Ukrainians | 99.2 /100 | #90 | Exceptional $42,015 |
| Immigrants | Western Europe | 99.2 /100 | #91 | Exceptional $41,990 |
| Argentineans | 99.1 /100 | #92 | Exceptional $41,952 |
| Immigrants | Grenada | 99.0 /100 | #93 | Exceptional $41,932 |
| Moroccans | 98.9 /100 | #94 | Exceptional $41,872 |
| Immigrants | Netherlands | 98.9 /100 | #95 | Exceptional $41,870 |
| South Africans | 98.8 /100 | #96 | Exceptional $41,825 |
| Immigrants | Hungary | 98.8 /100 | #97 | Exceptional $41,820 |
| Immigrants | Scotland | 98.7 /100 | #98 | Exceptional $41,771 |