Syrian vs Hmong Child Poverty Among Boys Under 16
COMPARE
Syrian
Hmong
Child Poverty Among Boys Under 16
Child Poverty Among Boys Under 16 Comparison
Syrians
Hmong
15.9%
CHILD POVERTY AMONG BOYS UNDER 16
77.5/ 100
METRIC RATING
154th/ 347
METRIC RANK
16.6%
CHILD POVERTY AMONG BOYS UNDER 16
38.4/ 100
METRIC RATING
186th/ 347
METRIC RANK
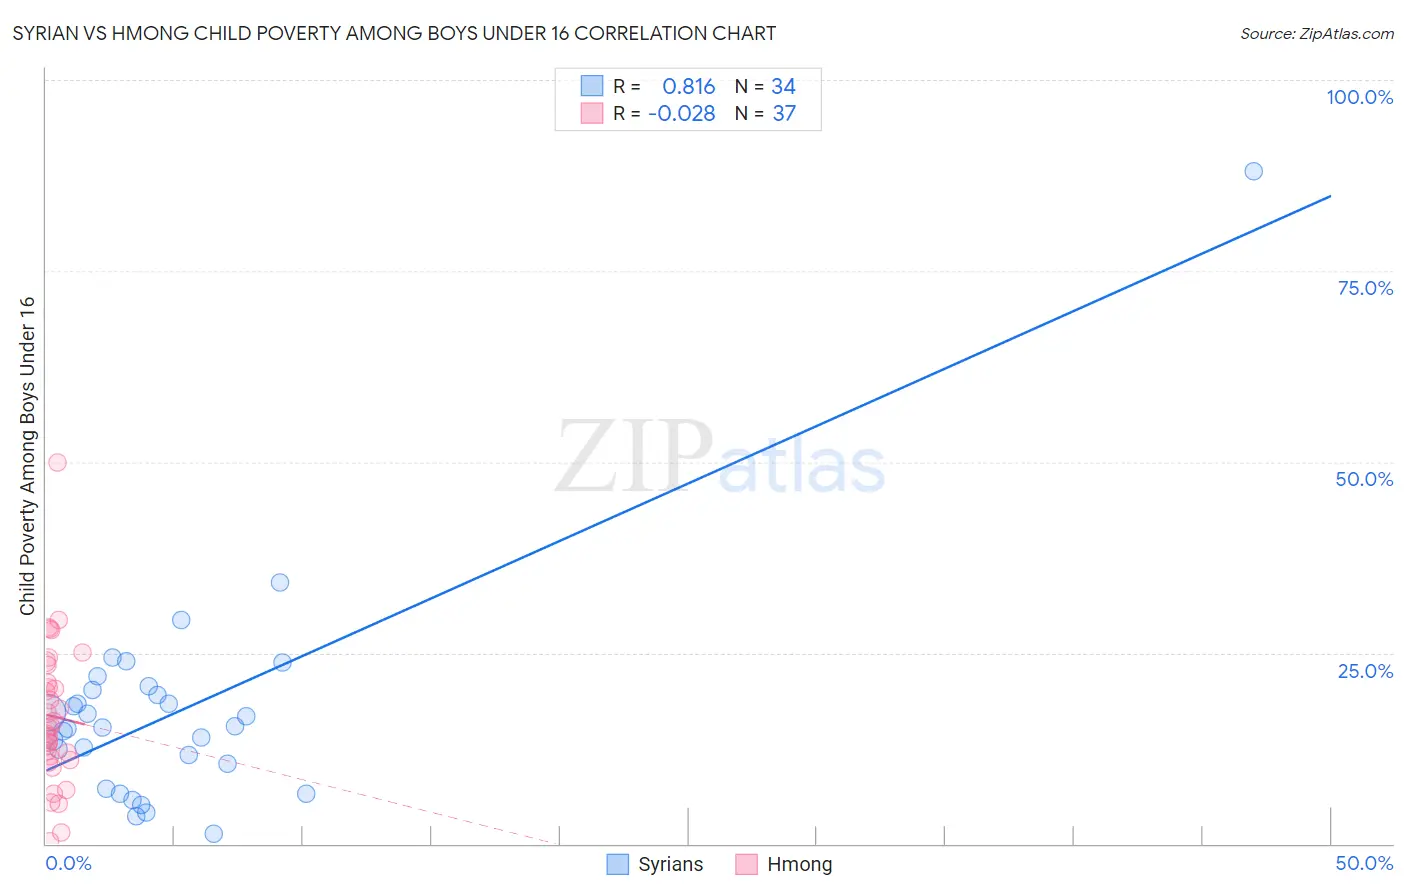
Syrian vs Hmong Child Poverty Among Boys Under 16 Correlation Chart
The statistical analysis conducted on geographies consisting of 262,504,378 people shows a very strong positive correlation between the proportion of Syrians and poverty level among boys under the age of 16 in the United States with a correlation coefficient (R) of 0.816 and weighted average of 15.9%. Similarly, the statistical analysis conducted on geographies consisting of 24,651,420 people shows no correlation between the proportion of Hmong and poverty level among boys under the age of 16 in the United States with a correlation coefficient (R) of -0.028 and weighted average of 16.6%, a difference of 4.9%.
Child Poverty Among Boys Under 16 Correlation Summary
| Measurement | Syrian | Hmong |
| Minimum | 1.4% | 0.39% |
| Maximum | 88.0% | 49.8% |
| Range | 86.6% | 49.5% |
| Mean | 17.2% | 16.7% |
| Median | 15.3% | 15.1% |
| Interquartile 25% (IQ1) | 10.5% | 11.2% |
| Interquartile 75% (IQ3) | 20.2% | 22.3% |
| Interquartile Range (IQR) | 9.7% | 11.1% |
| Standard Deviation (Sample) | 14.6% | 9.3% |
| Standard Deviation (Population) | 14.4% | 9.2% |
Similar Demographics by Child Poverty Among Boys Under 16
Demographics Similar to Syrians by Child Poverty Among Boys Under 16
In terms of child poverty among boys under 16, the demographic groups most similar to Syrians are French Canadian (15.9%, a difference of 0.15%), Israeli (15.9%, a difference of 0.16%), French (15.8%, a difference of 0.20%), Immigrants from Nepal (15.9%, a difference of 0.25%), and Yugoslavian (15.9%, a difference of 0.26%).
| Demographics | Rating | Rank | Child Poverty Among Boys Under 16 |
| Venezuelans | 82.1 /100 | #147 | Excellent 15.7% |
| Brazilians | 81.0 /100 | #148 | Excellent 15.8% |
| Slovaks | 80.3 /100 | #149 | Excellent 15.8% |
| Immigrants | Jordan | 80.2 /100 | #150 | Excellent 15.8% |
| Puget Sound Salish | 79.8 /100 | #151 | Good 15.8% |
| Immigrants | Venezuela | 79.5 /100 | #152 | Good 15.8% |
| French | 78.7 /100 | #153 | Good 15.8% |
| Syrians | 77.5 /100 | #154 | Good 15.9% |
| French Canadians | 76.6 /100 | #155 | Good 15.9% |
| Israelis | 76.5 /100 | #156 | Good 15.9% |
| Immigrants | Nepal | 76.0 /100 | #157 | Good 15.9% |
| Yugoslavians | 75.9 /100 | #158 | Good 15.9% |
| Immigrants | Chile | 74.8 /100 | #159 | Good 15.9% |
| Immigrants | Northern Africa | 71.3 /100 | #160 | Good 16.0% |
| Immigrants | Oceania | 71.3 /100 | #161 | Good 16.0% |
Demographics Similar to Hmong by Child Poverty Among Boys Under 16
In terms of child poverty among boys under 16, the demographic groups most similar to Hmong are Immigrants from Costa Rica (16.7%, a difference of 0.080%), Immigrants from South America (16.7%, a difference of 0.090%), Immigrants from Western Asia (16.6%, a difference of 0.22%), Celtic (16.6%, a difference of 0.25%), and Kenyan (16.6%, a difference of 0.29%).
| Demographics | Rating | Rank | Child Poverty Among Boys Under 16 |
| Hungarians | 47.3 /100 | #179 | Average 16.5% |
| Hawaiians | 45.5 /100 | #180 | Average 16.5% |
| South American Indians | 44.3 /100 | #181 | Average 16.5% |
| Lebanese | 43.3 /100 | #182 | Average 16.6% |
| Kenyans | 41.0 /100 | #183 | Average 16.6% |
| Celtics | 40.6 /100 | #184 | Average 16.6% |
| Immigrants | Western Asia | 40.4 /100 | #185 | Average 16.6% |
| Hmong | 38.4 /100 | #186 | Fair 16.6% |
| Immigrants | Costa Rica | 37.8 /100 | #187 | Fair 16.7% |
| Immigrants | South America | 37.7 /100 | #188 | Fair 16.7% |
| Immigrants | Morocco | 34.5 /100 | #189 | Fair 16.7% |
| Arabs | 31.1 /100 | #190 | Fair 16.8% |
| Alaska Natives | 29.8 /100 | #191 | Fair 16.8% |
| Immigrants | Uganda | 21.6 /100 | #192 | Fair 17.0% |
| Immigrants | Iraq | 21.6 /100 | #193 | Fair 17.0% |