Sudanese vs Puget Sound Salish Median Household Income
COMPARE
Sudanese
Puget Sound Salish
Median Household Income
Median Household Income Comparison
Sudanese
Puget Sound Salish
$78,529
MEDIAN HOUSEHOLD INCOME
1.5/ 100
METRIC RATING
248th/ 347
METRIC RANK
$84,011
MEDIAN HOUSEHOLD INCOME
33.2/ 100
METRIC RATING
186th/ 347
METRIC RANK
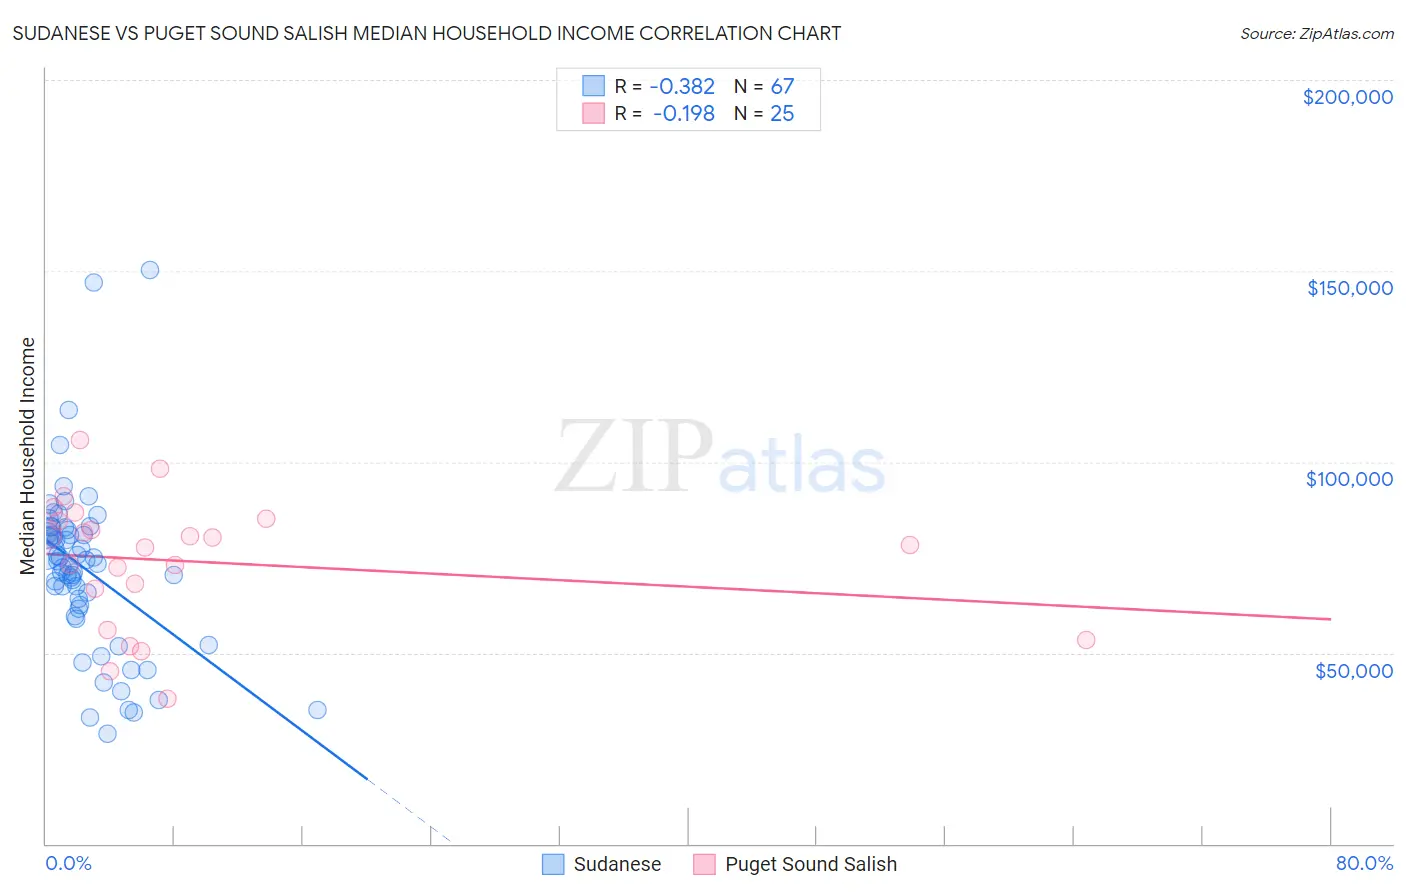
Sudanese vs Puget Sound Salish Median Household Income Correlation Chart
The statistical analysis conducted on geographies consisting of 110,096,720 people shows a mild negative correlation between the proportion of Sudanese and median household income in the United States with a correlation coefficient (R) of -0.382 and weighted average of $78,529. Similarly, the statistical analysis conducted on geographies consisting of 46,152,941 people shows a poor negative correlation between the proportion of Puget Sound Salish and median household income in the United States with a correlation coefficient (R) of -0.198 and weighted average of $84,011, a difference of 7.0%.
Median Household Income Correlation Summary
| Measurement | Sudanese | Puget Sound Salish |
| Minimum | $28,750 | $37,964 |
| Maximum | $150,237 | $105,684 |
| Range | $121,487 | $67,720 |
| Mean | $71,874 | $73,927 |
| Median | $73,369 | $78,333 |
| Interquartile 25% (IQ1) | $61,639 | $61,302 |
| Interquartile 75% (IQ3) | $82,076 | $84,790 |
| Interquartile Range (IQR) | $20,437 | $23,488 |
| Standard Deviation (Sample) | $22,253 | $16,803 |
| Standard Deviation (Population) | $22,086 | $16,464 |
Similar Demographics by Median Household Income
Demographics Similar to Sudanese by Median Household Income
In terms of median household income, the demographic groups most similar to Sudanese are West Indian ($78,455, a difference of 0.090%), Immigrants from Burma/Myanmar ($78,682, a difference of 0.19%), Immigrants from Laos ($78,327, a difference of 0.26%), Central American ($78,803, a difference of 0.35%), and Inupiat ($78,841, a difference of 0.40%).
| Demographics | Rating | Rank | Median Household Income |
| Immigrants | Nonimmigrants | 2.6 /100 | #241 | Tragic $79,429 |
| Immigrants | Sudan | 2.1 /100 | #242 | Tragic $79,103 |
| Immigrants | Barbados | 1.9 /100 | #243 | Tragic $78,989 |
| Marshallese | 1.9 /100 | #244 | Tragic $78,930 |
| Inupiat | 1.8 /100 | #245 | Tragic $78,841 |
| Central Americans | 1.7 /100 | #246 | Tragic $78,803 |
| Immigrants | Burma/Myanmar | 1.6 /100 | #247 | Tragic $78,682 |
| Sudanese | 1.5 /100 | #248 | Tragic $78,529 |
| West Indians | 1.4 /100 | #249 | Tragic $78,455 |
| Immigrants | Laos | 1.3 /100 | #250 | Tragic $78,327 |
| Mexican American Indians | 1.2 /100 | #251 | Tragic $78,166 |
| Immigrants | West Indies | 1.0 /100 | #252 | Tragic $77,956 |
| Immigrants | St. Vincent and the Grenadines | 0.9 /100 | #253 | Tragic $77,690 |
| Sub-Saharan Africans | 0.8 /100 | #254 | Tragic $77,631 |
| Immigrants | Middle Africa | 0.8 /100 | #255 | Tragic $77,559 |
Demographics Similar to Puget Sound Salish by Median Household Income
In terms of median household income, the demographic groups most similar to Puget Sound Salish are Belgian ($84,008, a difference of 0.0%), Tlingit-Haida ($83,968, a difference of 0.050%), Kenyan ($84,085, a difference of 0.090%), Immigrants from Colombia ($83,902, a difference of 0.13%), and Slovak ($83,798, a difference of 0.25%).
| Demographics | Rating | Rank | Median Household Income |
| English | 47.0 /100 | #179 | Average $84,915 |
| Immigrants | Portugal | 44.2 /100 | #180 | Average $84,740 |
| Hawaiians | 44.1 /100 | #181 | Average $84,729 |
| Uruguayans | 43.5 /100 | #182 | Average $84,691 |
| Spaniards | 42.7 /100 | #183 | Average $84,644 |
| Immigrants | Eastern Africa | 37.4 /100 | #184 | Fair $84,299 |
| Kenyans | 34.2 /100 | #185 | Fair $84,085 |
| Puget Sound Salish | 33.2 /100 | #186 | Fair $84,011 |
| Belgians | 33.2 /100 | #187 | Fair $84,008 |
| Tlingit-Haida | 32.6 /100 | #188 | Fair $83,968 |
| Immigrants | Colombia | 31.7 /100 | #189 | Fair $83,902 |
| Slovaks | 30.2 /100 | #190 | Fair $83,798 |
| Iraqis | 29.6 /100 | #191 | Fair $83,753 |
| Welsh | 28.0 /100 | #192 | Fair $83,628 |
| Finns | 27.7 /100 | #193 | Fair $83,607 |