Sudanese vs Arab Median Household Income
COMPARE
Sudanese
Arab
Median Household Income
Median Household Income Comparison
Sudanese
Arabs
$78,529
MEDIAN HOUSEHOLD INCOME
1.5/ 100
METRIC RATING
248th/ 347
METRIC RANK
$88,398
MEDIAN HOUSEHOLD INCOME
89.2/ 100
METRIC RATING
138th/ 347
METRIC RANK
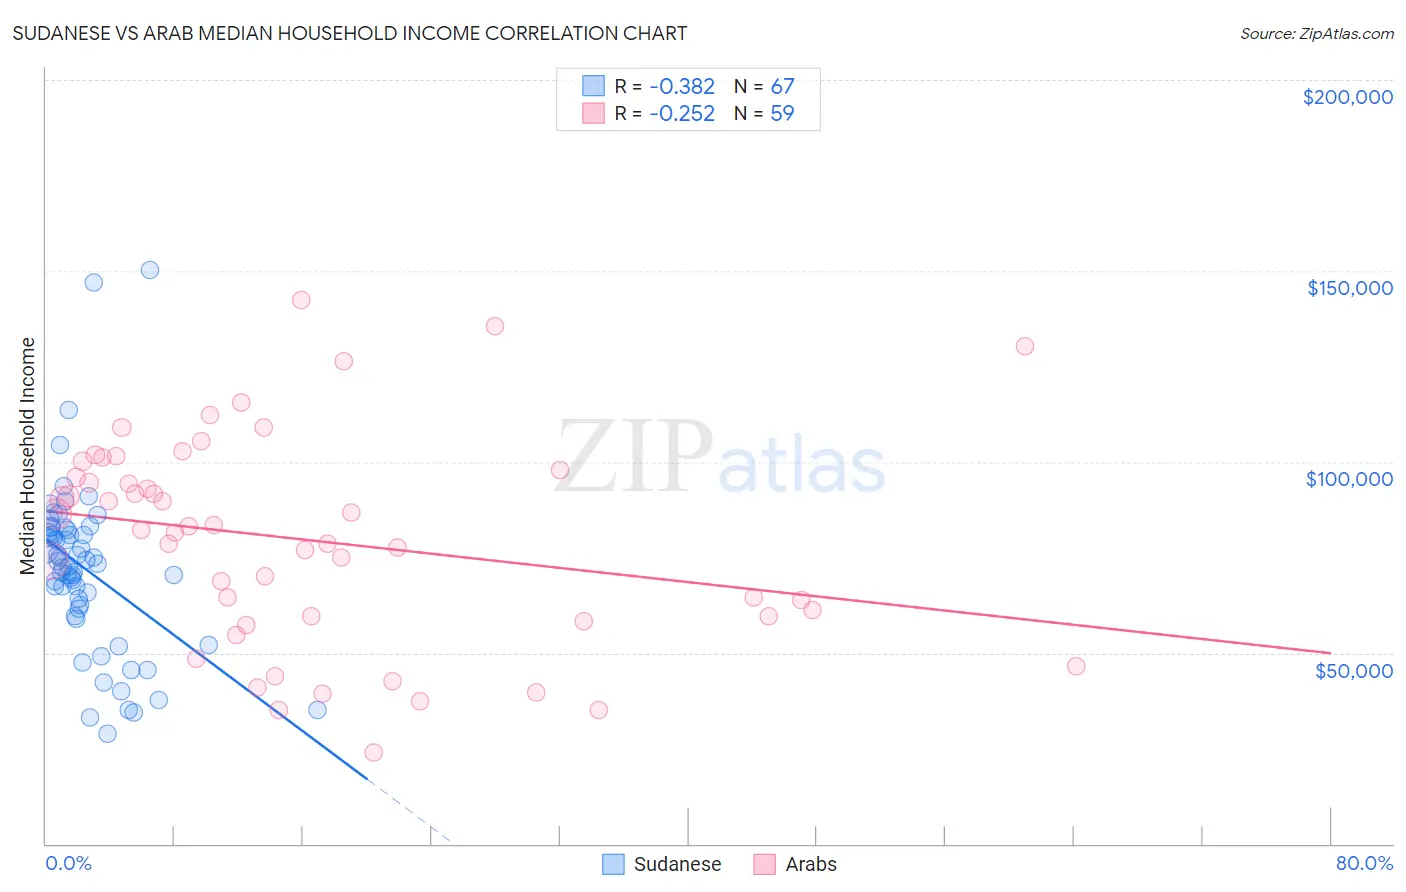
Sudanese vs Arab Median Household Income Correlation Chart
The statistical analysis conducted on geographies consisting of 110,096,720 people shows a mild negative correlation between the proportion of Sudanese and median household income in the United States with a correlation coefficient (R) of -0.382 and weighted average of $78,529. Similarly, the statistical analysis conducted on geographies consisting of 486,242,528 people shows a weak negative correlation between the proportion of Arabs and median household income in the United States with a correlation coefficient (R) of -0.252 and weighted average of $88,398, a difference of 12.6%.
Median Household Income Correlation Summary
| Measurement | Sudanese | Arab |
| Minimum | $28,750 | $23,929 |
| Maximum | $150,237 | $142,260 |
| Range | $121,487 | $118,331 |
| Mean | $71,874 | $79,535 |
| Median | $73,369 | $82,260 |
| Interquartile 25% (IQ1) | $61,639 | $59,535 |
| Interquartile 75% (IQ3) | $82,076 | $97,787 |
| Interquartile Range (IQR) | $20,437 | $38,252 |
| Standard Deviation (Sample) | $22,253 | $27,234 |
| Standard Deviation (Population) | $22,086 | $27,002 |
Similar Demographics by Median Household Income
Demographics Similar to Sudanese by Median Household Income
In terms of median household income, the demographic groups most similar to Sudanese are West Indian ($78,455, a difference of 0.090%), Immigrants from Burma/Myanmar ($78,682, a difference of 0.19%), Immigrants from Laos ($78,327, a difference of 0.26%), Central American ($78,803, a difference of 0.35%), and Inupiat ($78,841, a difference of 0.40%).
| Demographics | Rating | Rank | Median Household Income |
| Immigrants | Nonimmigrants | 2.6 /100 | #241 | Tragic $79,429 |
| Immigrants | Sudan | 2.1 /100 | #242 | Tragic $79,103 |
| Immigrants | Barbados | 1.9 /100 | #243 | Tragic $78,989 |
| Marshallese | 1.9 /100 | #244 | Tragic $78,930 |
| Inupiat | 1.8 /100 | #245 | Tragic $78,841 |
| Central Americans | 1.7 /100 | #246 | Tragic $78,803 |
| Immigrants | Burma/Myanmar | 1.6 /100 | #247 | Tragic $78,682 |
| Sudanese | 1.5 /100 | #248 | Tragic $78,529 |
| West Indians | 1.4 /100 | #249 | Tragic $78,455 |
| Immigrants | Laos | 1.3 /100 | #250 | Tragic $78,327 |
| Mexican American Indians | 1.2 /100 | #251 | Tragic $78,166 |
| Immigrants | West Indies | 1.0 /100 | #252 | Tragic $77,956 |
| Immigrants | St. Vincent and the Grenadines | 0.9 /100 | #253 | Tragic $77,690 |
| Sub-Saharan Africans | 0.8 /100 | #254 | Tragic $77,631 |
| Immigrants | Middle Africa | 0.8 /100 | #255 | Tragic $77,559 |
Demographics Similar to Arabs by Median Household Income
In terms of median household income, the demographic groups most similar to Arabs are Immigrants from Chile ($88,388, a difference of 0.010%), Sierra Leonean ($88,463, a difference of 0.070%), Polish ($88,472, a difference of 0.080%), Immigrants from Sierra Leone ($88,498, a difference of 0.11%), and Swedish ($88,524, a difference of 0.14%).
| Demographics | Rating | Rank | Median Household Income |
| Immigrants | Syria | 91.4 /100 | #131 | Exceptional $88,792 |
| Europeans | 91.2 /100 | #132 | Exceptional $88,751 |
| Immigrants | Ethiopia | 90.9 /100 | #133 | Exceptional $88,687 |
| Swedes | 90.0 /100 | #134 | Exceptional $88,524 |
| Immigrants | Sierra Leone | 89.9 /100 | #135 | Excellent $88,498 |
| Poles | 89.7 /100 | #136 | Excellent $88,472 |
| Sierra Leoneans | 89.6 /100 | #137 | Excellent $88,463 |
| Arabs | 89.2 /100 | #138 | Excellent $88,398 |
| Immigrants | Chile | 89.2 /100 | #139 | Excellent $88,388 |
| Lebanese | 87.2 /100 | #140 | Excellent $88,091 |
| Immigrants | Morocco | 86.0 /100 | #141 | Excellent $87,930 |
| Canadians | 84.7 /100 | #142 | Excellent $87,769 |
| Danes | 83.9 /100 | #143 | Excellent $87,676 |
| Serbians | 83.0 /100 | #144 | Excellent $87,572 |
| Ugandans | 82.9 /100 | #145 | Excellent $87,557 |