Sudanese vs Immigrants from Italy Median Household Income
COMPARE
Sudanese
Immigrants from Italy
Median Household Income
Median Household Income Comparison
Sudanese
Immigrants from Italy
$78,529
MEDIAN HOUSEHOLD INCOME
1.5/ 100
METRIC RATING
248th/ 347
METRIC RANK
$93,465
MEDIAN HOUSEHOLD INCOME
99.5/ 100
METRIC RATING
75th/ 347
METRIC RANK
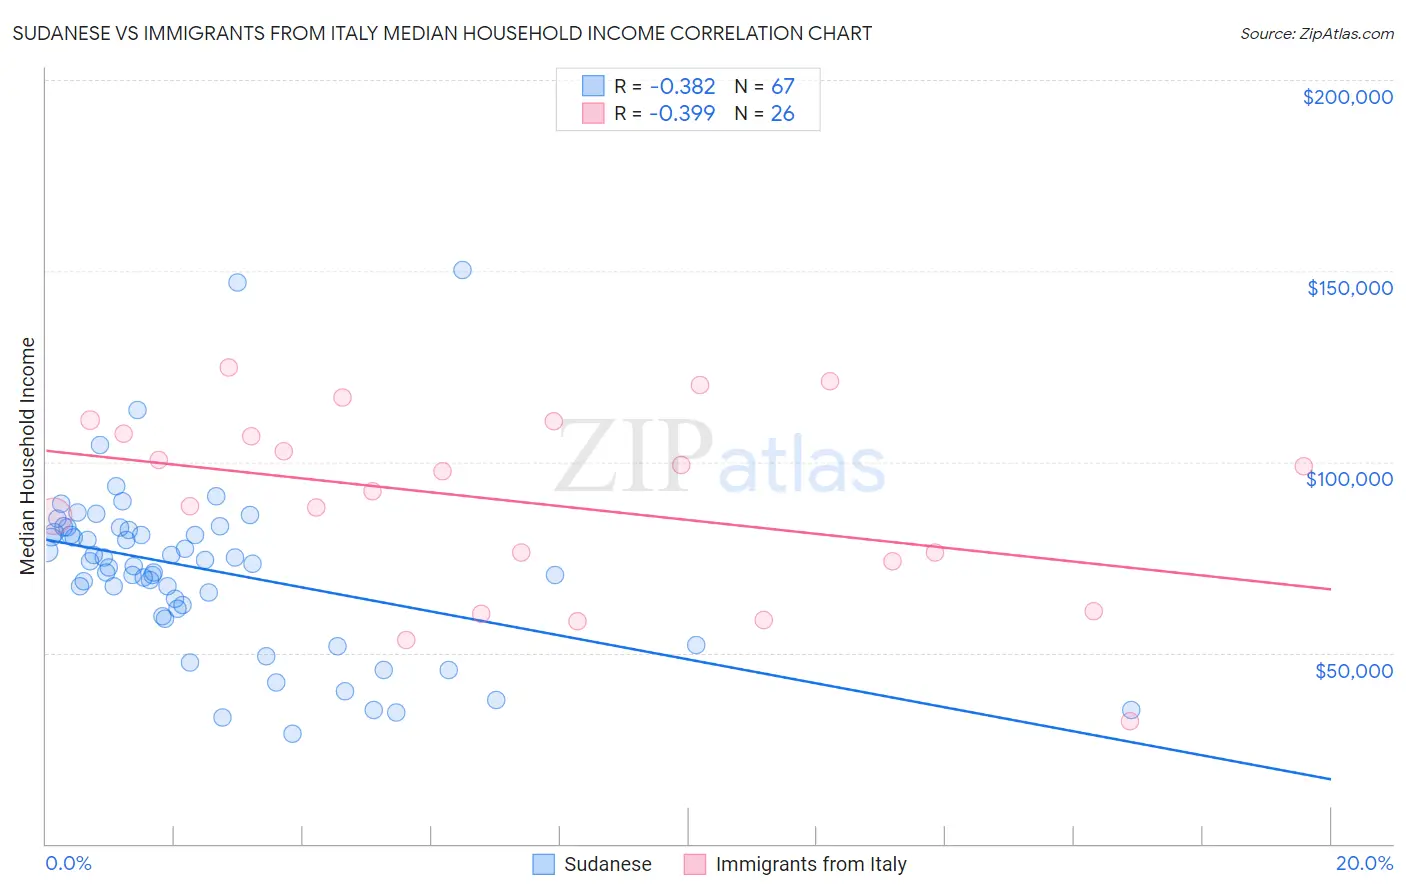
Sudanese vs Immigrants from Italy Median Household Income Correlation Chart
The statistical analysis conducted on geographies consisting of 110,096,720 people shows a mild negative correlation between the proportion of Sudanese and median household income in the United States with a correlation coefficient (R) of -0.382 and weighted average of $78,529. Similarly, the statistical analysis conducted on geographies consisting of 324,128,900 people shows a mild negative correlation between the proportion of Immigrants from Italy and median household income in the United States with a correlation coefficient (R) of -0.399 and weighted average of $93,465, a difference of 19.0%.
Median Household Income Correlation Summary
| Measurement | Sudanese | Immigrants from Italy |
| Minimum | $28,750 | $31,923 |
| Maximum | $150,237 | $124,607 |
| Range | $121,487 | $92,684 |
| Mean | $71,874 | $89,307 |
| Median | $73,369 | $94,900 |
| Interquartile 25% (IQ1) | $61,639 | $73,911 |
| Interquartile 75% (IQ3) | $82,076 | $107,408 |
| Interquartile Range (IQR) | $20,437 | $33,497 |
| Standard Deviation (Sample) | $22,253 | $24,372 |
| Standard Deviation (Population) | $22,086 | $23,899 |
Similar Demographics by Median Household Income
Demographics Similar to Sudanese by Median Household Income
In terms of median household income, the demographic groups most similar to Sudanese are West Indian ($78,455, a difference of 0.090%), Immigrants from Burma/Myanmar ($78,682, a difference of 0.19%), Immigrants from Laos ($78,327, a difference of 0.26%), Central American ($78,803, a difference of 0.35%), and Inupiat ($78,841, a difference of 0.40%).
| Demographics | Rating | Rank | Median Household Income |
| Immigrants | Nonimmigrants | 2.6 /100 | #241 | Tragic $79,429 |
| Immigrants | Sudan | 2.1 /100 | #242 | Tragic $79,103 |
| Immigrants | Barbados | 1.9 /100 | #243 | Tragic $78,989 |
| Marshallese | 1.9 /100 | #244 | Tragic $78,930 |
| Inupiat | 1.8 /100 | #245 | Tragic $78,841 |
| Central Americans | 1.7 /100 | #246 | Tragic $78,803 |
| Immigrants | Burma/Myanmar | 1.6 /100 | #247 | Tragic $78,682 |
| Sudanese | 1.5 /100 | #248 | Tragic $78,529 |
| West Indians | 1.4 /100 | #249 | Tragic $78,455 |
| Immigrants | Laos | 1.3 /100 | #250 | Tragic $78,327 |
| Mexican American Indians | 1.2 /100 | #251 | Tragic $78,166 |
| Immigrants | West Indies | 1.0 /100 | #252 | Tragic $77,956 |
| Immigrants | St. Vincent and the Grenadines | 0.9 /100 | #253 | Tragic $77,690 |
| Sub-Saharan Africans | 0.8 /100 | #254 | Tragic $77,631 |
| Immigrants | Middle Africa | 0.8 /100 | #255 | Tragic $77,559 |
Demographics Similar to Immigrants from Italy by Median Household Income
In terms of median household income, the demographic groups most similar to Immigrants from Italy are South African ($93,379, a difference of 0.090%), Immigrants from Afghanistan ($93,375, a difference of 0.10%), Immigrants from Latvia ($93,602, a difference of 0.15%), Immigrants from Egypt ($93,700, a difference of 0.25%), and Immigrants from Bulgaria ($93,148, a difference of 0.34%).
| Demographics | Rating | Rank | Median Household Income |
| Mongolians | 99.7 /100 | #68 | Exceptional $93,971 |
| Argentineans | 99.7 /100 | #69 | Exceptional $93,960 |
| Immigrants | Fiji | 99.7 /100 | #70 | Exceptional $93,933 |
| Immigrants | Philippines | 99.6 /100 | #71 | Exceptional $93,899 |
| Lithuanians | 99.6 /100 | #72 | Exceptional $93,852 |
| Immigrants | Egypt | 99.6 /100 | #73 | Exceptional $93,700 |
| Immigrants | Latvia | 99.6 /100 | #74 | Exceptional $93,602 |
| Immigrants | Italy | 99.5 /100 | #75 | Exceptional $93,465 |
| South Africans | 99.5 /100 | #76 | Exceptional $93,379 |
| Immigrants | Afghanistan | 99.5 /100 | #77 | Exceptional $93,375 |
| Immigrants | Bulgaria | 99.4 /100 | #78 | Exceptional $93,148 |
| Sri Lankans | 99.4 /100 | #79 | Exceptional $93,093 |
| Tongans | 99.4 /100 | #80 | Exceptional $93,076 |
| Immigrants | Eastern Europe | 99.4 /100 | #81 | Exceptional $93,051 |
| Immigrants | Spain | 99.3 /100 | #82 | Exceptional $92,732 |