Sudanese vs Puget Sound Salish Cognitive Disability
COMPARE
Sudanese
Puget Sound Salish
Cognitive Disability
Cognitive Disability Comparison
Sudanese
Puget Sound Salish
18.9%
COGNITIVE DISABILITY
0.0/ 100
METRIC RATING
334th/ 347
METRIC RANK
17.5%
COGNITIVE DISABILITY
10.9/ 100
METRIC RATING
205th/ 347
METRIC RANK
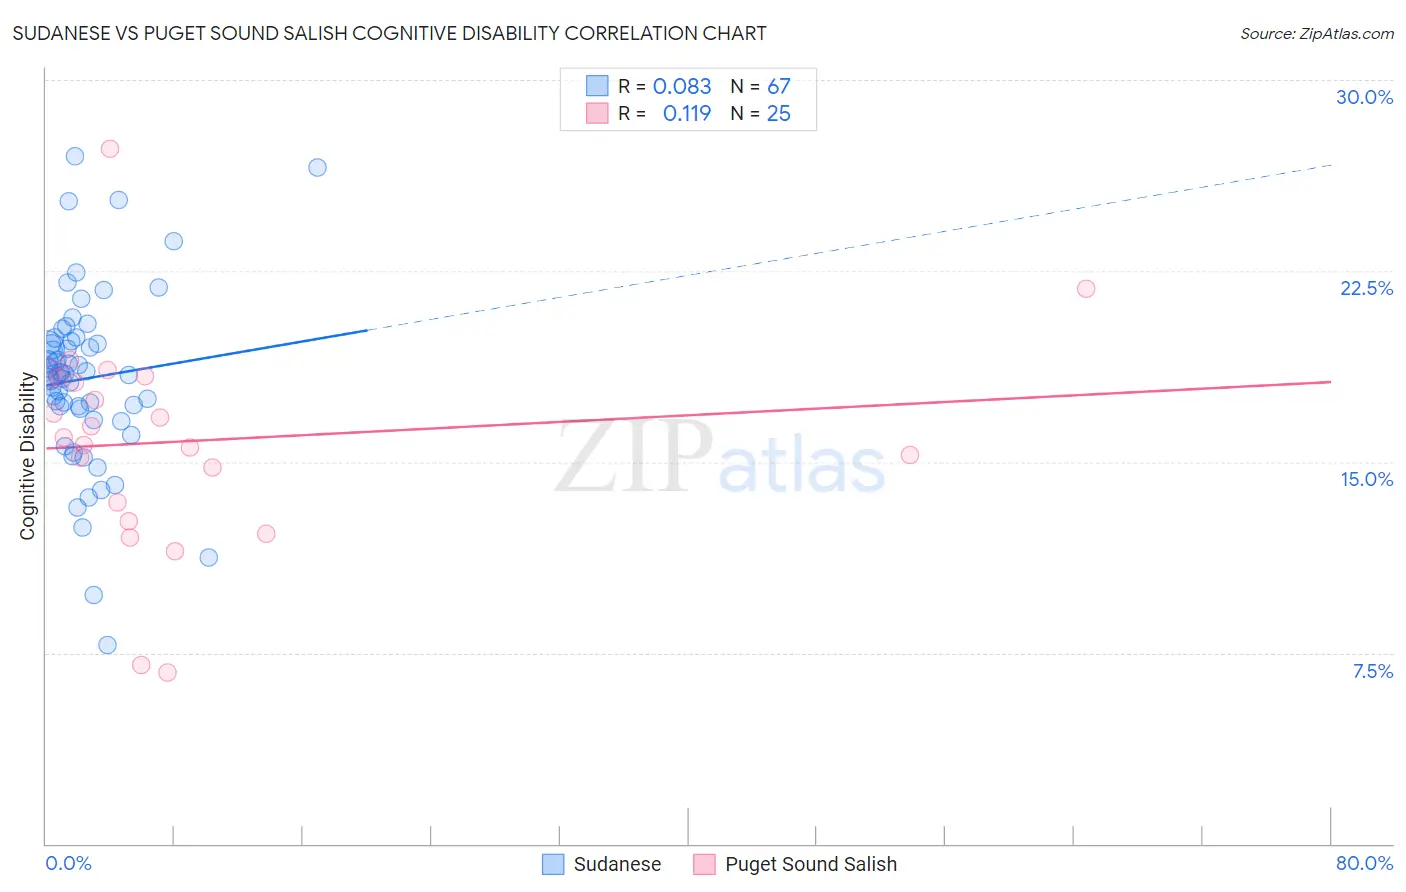
Sudanese vs Puget Sound Salish Cognitive Disability Correlation Chart
The statistical analysis conducted on geographies consisting of 110,121,585 people shows a slight positive correlation between the proportion of Sudanese and percentage of population with cognitive disability in the United States with a correlation coefficient (R) of 0.083 and weighted average of 18.9%. Similarly, the statistical analysis conducted on geographies consisting of 46,155,775 people shows a poor positive correlation between the proportion of Puget Sound Salish and percentage of population with cognitive disability in the United States with a correlation coefficient (R) of 0.119 and weighted average of 17.5%, a difference of 7.6%.
Cognitive Disability Correlation Summary
| Measurement | Sudanese | Puget Sound Salish |
| Minimum | 7.8% | 6.7% |
| Maximum | 27.0% | 27.3% |
| Range | 19.2% | 20.6% |
| Mean | 18.3% | 15.8% |
| Median | 18.4% | 16.0% |
| Interquartile 25% (IQ1) | 17.1% | 13.0% |
| Interquartile 75% (IQ3) | 19.7% | 18.3% |
| Interquartile Range (IQR) | 2.7% | 5.3% |
| Standard Deviation (Sample) | 3.5% | 4.3% |
| Standard Deviation (Population) | 3.4% | 4.2% |
Similar Demographics by Cognitive Disability
Demographics Similar to Sudanese by Cognitive Disability
In terms of cognitive disability, the demographic groups most similar to Sudanese are Immigrants from Yemen (18.8%, a difference of 0.38%), Immigrants from Sudan (18.8%, a difference of 0.44%), Pima (18.8%, a difference of 0.45%), Immigrants from Dominican Republic (18.8%, a difference of 0.52%), and Senegalese (19.0%, a difference of 0.54%).
| Demographics | Rating | Rank | Cognitive Disability |
| U.S. Virgin Islanders | 0.0 /100 | #327 | Tragic 18.7% |
| Kiowa | 0.0 /100 | #328 | Tragic 18.7% |
| Navajo | 0.0 /100 | #329 | Tragic 18.8% |
| Immigrants | Dominican Republic | 0.0 /100 | #330 | Tragic 18.8% |
| Pima | 0.0 /100 | #331 | Tragic 18.8% |
| Immigrants | Sudan | 0.0 /100 | #332 | Tragic 18.8% |
| Immigrants | Yemen | 0.0 /100 | #333 | Tragic 18.8% |
| Sudanese | 0.0 /100 | #334 | Tragic 18.9% |
| Senegalese | 0.0 /100 | #335 | Tragic 19.0% |
| Blacks/African Americans | 0.0 /100 | #336 | Tragic 19.0% |
| Immigrants | Saudi Arabia | 0.0 /100 | #337 | Tragic 19.1% |
| Lumbee | 0.0 /100 | #338 | Tragic 19.1% |
| Puerto Ricans | 0.0 /100 | #339 | Tragic 19.2% |
| Cape Verdeans | 0.0 /100 | #340 | Tragic 19.2% |
| Tohono O'odham | 0.0 /100 | #341 | Tragic 19.3% |
Demographics Similar to Puget Sound Salish by Cognitive Disability
In terms of cognitive disability, the demographic groups most similar to Puget Sound Salish are Immigrants from Caribbean (17.5%, a difference of 0.010%), Immigrants from Zimbabwe (17.5%, a difference of 0.010%), Alaska Native (17.5%, a difference of 0.040%), Immigrants from Morocco (17.5%, a difference of 0.080%), and Immigrants from Latin America (17.6%, a difference of 0.090%).
| Demographics | Rating | Rank | Cognitive Disability |
| Immigrants | Panama | 14.8 /100 | #198 | Poor 17.5% |
| Immigrants | Singapore | 14.3 /100 | #199 | Poor 17.5% |
| Haitians | 14.1 /100 | #200 | Poor 17.5% |
| South American Indians | 13.0 /100 | #201 | Poor 17.5% |
| Immigrants | Morocco | 12.0 /100 | #202 | Poor 17.5% |
| Immigrants | Caribbean | 11.0 /100 | #203 | Poor 17.5% |
| Immigrants | Zimbabwe | 11.0 /100 | #204 | Poor 17.5% |
| Puget Sound Salish | 10.9 /100 | #205 | Poor 17.5% |
| Alaska Natives | 10.4 /100 | #206 | Poor 17.5% |
| Immigrants | Latin America | 9.7 /100 | #207 | Tragic 17.6% |
| Immigrants | Cameroon | 9.3 /100 | #208 | Tragic 17.6% |
| Immigrants | Trinidad and Tobago | 8.7 /100 | #209 | Tragic 17.6% |
| Immigrants | Jamaica | 8.5 /100 | #210 | Tragic 17.6% |
| Taiwanese | 7.7 /100 | #211 | Tragic 17.6% |
| Immigrants | Oceania | 7.3 /100 | #212 | Tragic 17.6% |