Sudanese vs Puget Sound Salish Male Unemployment
COMPARE
Sudanese
Puget Sound Salish
Male Unemployment
Male Unemployment Comparison
Sudanese
Puget Sound Salish
4.8%
MALE UNEMPLOYMENT
99.8/ 100
METRIC RATING
31st/ 347
METRIC RANK
5.5%
MALE UNEMPLOYMENT
5.6/ 100
METRIC RATING
214th/ 347
METRIC RANK
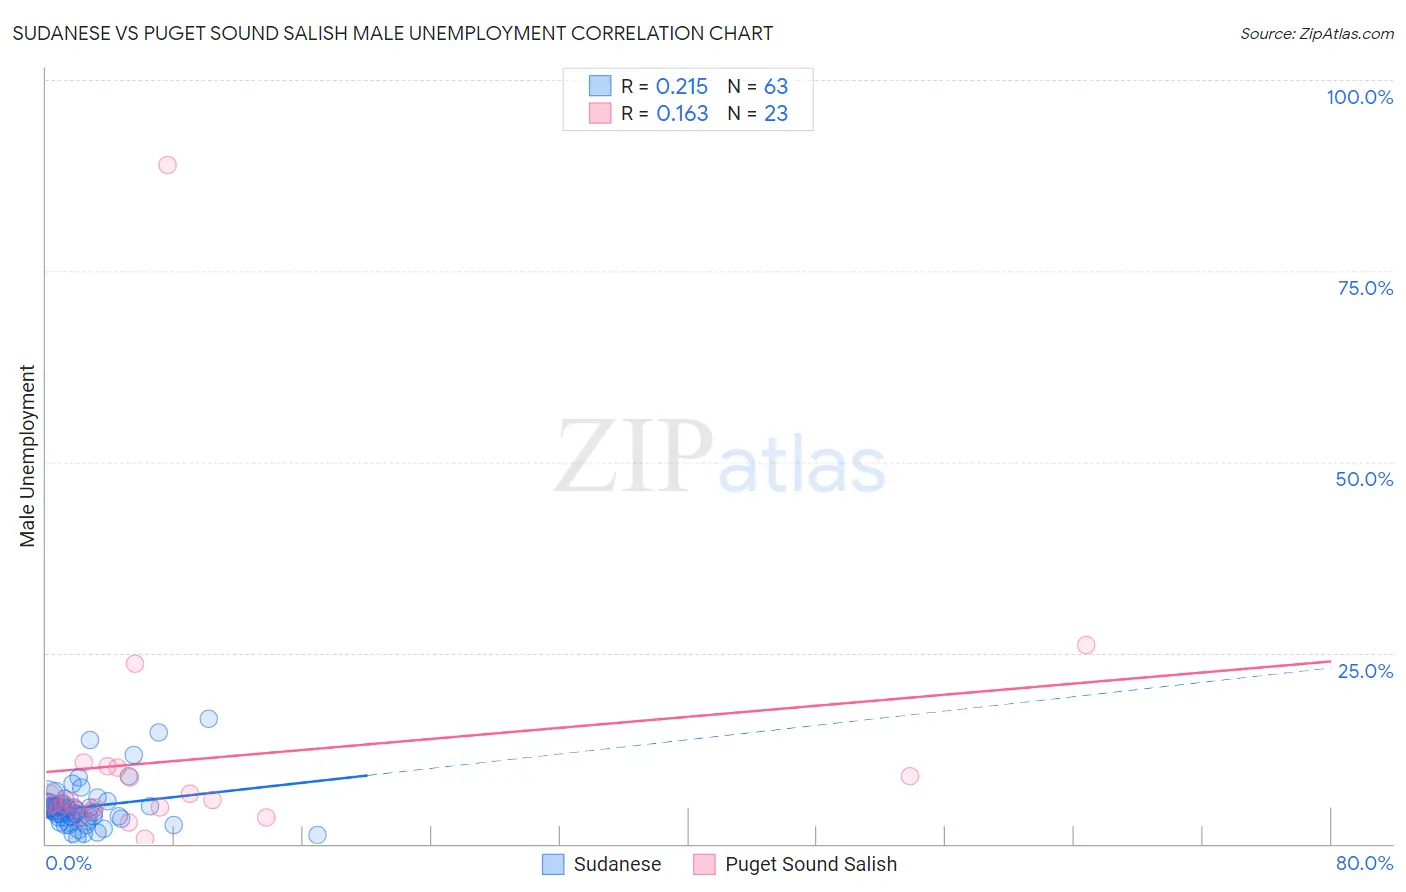
Sudanese vs Puget Sound Salish Male Unemployment Correlation Chart
The statistical analysis conducted on geographies consisting of 110,013,962 people shows a weak positive correlation between the proportion of Sudanese and unemployment rate among males in the United States with a correlation coefficient (R) of 0.215 and weighted average of 4.8%. Similarly, the statistical analysis conducted on geographies consisting of 46,067,216 people shows a poor positive correlation between the proportion of Puget Sound Salish and unemployment rate among males in the United States with a correlation coefficient (R) of 0.163 and weighted average of 5.5%, a difference of 14.1%.
Male Unemployment Correlation Summary
| Measurement | Sudanese | Puget Sound Salish |
| Minimum | 0.80% | 0.60% |
| Maximum | 16.4% | 88.9% |
| Range | 15.6% | 88.3% |
| Mean | 4.8% | 11.1% |
| Median | 4.4% | 5.5% |
| Interquartile 25% (IQ1) | 3.4% | 4.6% |
| Interquartile 75% (IQ3) | 5.2% | 10.0% |
| Interquartile Range (IQR) | 1.8% | 5.4% |
| Standard Deviation (Sample) | 3.0% | 18.0% |
| Standard Deviation (Population) | 2.9% | 17.6% |
Similar Demographics by Male Unemployment
Demographics Similar to Sudanese by Male Unemployment
In terms of male unemployment, the demographic groups most similar to Sudanese are Immigrants from Nepal (4.8%, a difference of 0.010%), British (4.8%, a difference of 0.25%), Latvian (4.8%, a difference of 0.31%), Welsh (4.8%, a difference of 0.40%), and Scottish (4.8%, a difference of 0.56%).
| Demographics | Rating | Rank | Male Unemployment |
| Immigrants | South Central Asia | 99.9 /100 | #24 | Exceptional 4.8% |
| Zimbabweans | 99.9 /100 | #25 | Exceptional 4.8% |
| Dutch | 99.9 /100 | #26 | Exceptional 4.8% |
| Belgians | 99.9 /100 | #27 | Exceptional 4.8% |
| Bulgarians | 99.8 /100 | #28 | Exceptional 4.8% |
| Scottish | 99.8 /100 | #29 | Exceptional 4.8% |
| British | 99.8 /100 | #30 | Exceptional 4.8% |
| Sudanese | 99.8 /100 | #31 | Exceptional 4.8% |
| Immigrants | Nepal | 99.8 /100 | #32 | Exceptional 4.8% |
| Latvians | 99.7 /100 | #33 | Exceptional 4.8% |
| Welsh | 99.7 /100 | #34 | Exceptional 4.8% |
| Paraguayans | 99.5 /100 | #35 | Exceptional 4.9% |
| Immigrants | Singapore | 99.4 /100 | #36 | Exceptional 4.9% |
| Scotch-Irish | 99.4 /100 | #37 | Exceptional 4.9% |
| Immigrants | Bosnia and Herzegovina | 99.4 /100 | #38 | Exceptional 4.9% |
Demographics Similar to Puget Sound Salish by Male Unemployment
In terms of male unemployment, the demographic groups most similar to Puget Sound Salish are Ugandan (5.5%, a difference of 0.17%), Samoan (5.5%, a difference of 0.20%), Hmong (5.5%, a difference of 0.33%), Immigrants (5.5%, a difference of 0.37%), and Delaware (5.5%, a difference of 0.42%).
| Demographics | Rating | Rank | Male Unemployment |
| Immigrants | Syria | 9.3 /100 | #207 | Tragic 5.5% |
| Immigrants | Lebanon | 8.6 /100 | #208 | Tragic 5.5% |
| Immigrants | Middle Africa | 8.3 /100 | #209 | Tragic 5.5% |
| South American Indians | 7.6 /100 | #210 | Tragic 5.5% |
| Israelis | 7.4 /100 | #211 | Tragic 5.5% |
| Hmong | 7.0 /100 | #212 | Tragic 5.5% |
| Ugandans | 6.3 /100 | #213 | Tragic 5.5% |
| Puget Sound Salish | 5.6 /100 | #214 | Tragic 5.5% |
| Samoans | 4.9 /100 | #215 | Tragic 5.5% |
| Immigrants | Immigrants | 4.3 /100 | #216 | Tragic 5.5% |
| Delaware | 4.2 /100 | #217 | Tragic 5.5% |
| Immigrants | Albania | 3.6 /100 | #218 | Tragic 5.5% |
| Immigrants | Western Asia | 3.5 /100 | #219 | Tragic 5.6% |
| Portuguese | 3.5 /100 | #220 | Tragic 5.6% |
| Soviet Union | 3.2 /100 | #221 | Tragic 5.6% |