Sudanese vs Immigrants from Guatemala Median Household Income
COMPARE
Sudanese
Immigrants from Guatemala
Median Household Income
Median Household Income Comparison
Sudanese
Immigrants from Guatemala
$78,529
MEDIAN HOUSEHOLD INCOME
1.5/ 100
METRIC RATING
248th/ 347
METRIC RANK
$75,123
MEDIAN HOUSEHOLD INCOME
0.2/ 100
METRIC RATING
279th/ 347
METRIC RANK
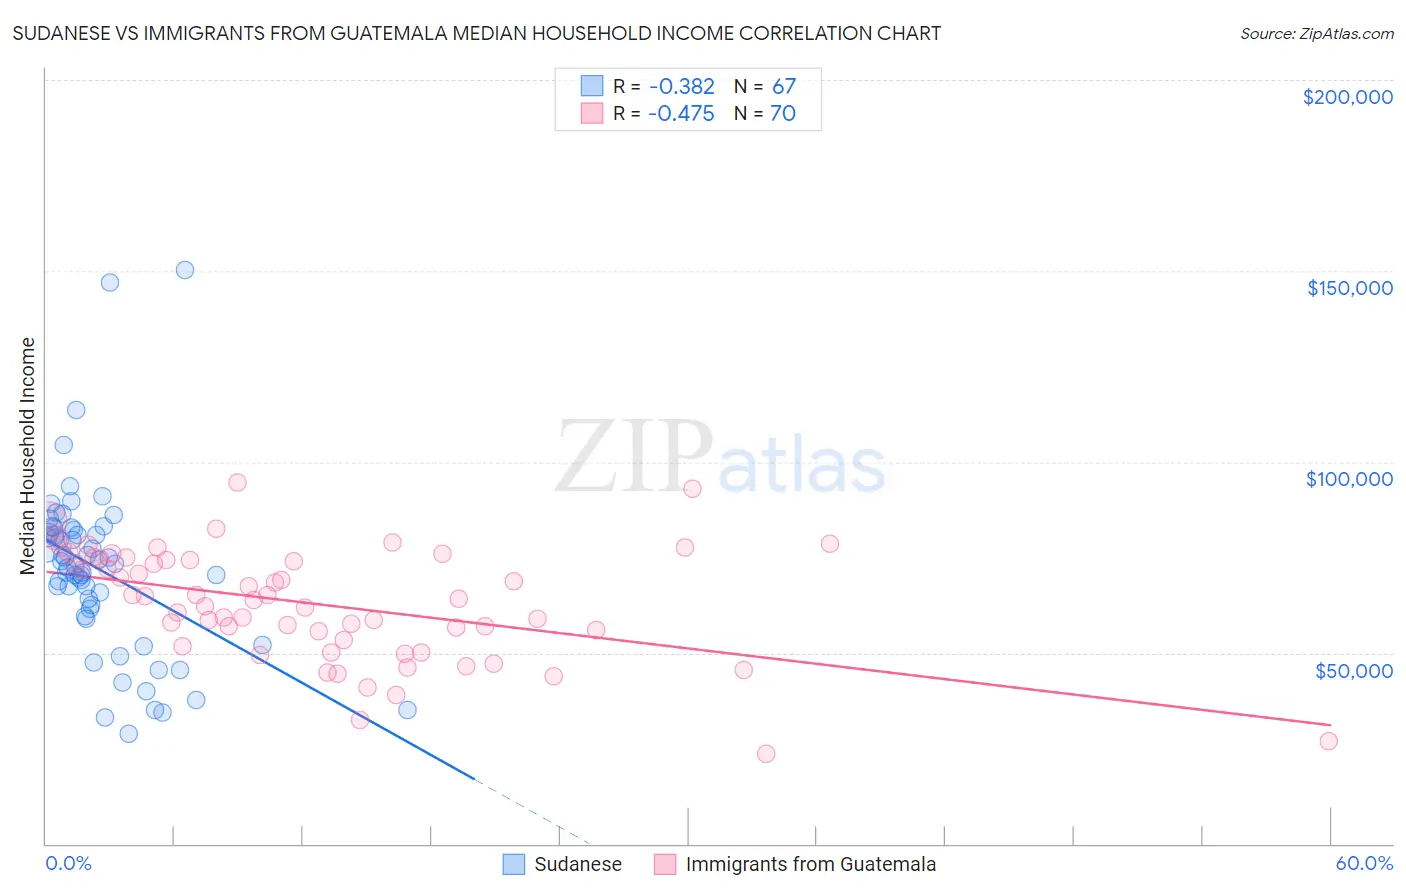
Sudanese vs Immigrants from Guatemala Median Household Income Correlation Chart
The statistical analysis conducted on geographies consisting of 110,096,720 people shows a mild negative correlation between the proportion of Sudanese and median household income in the United States with a correlation coefficient (R) of -0.382 and weighted average of $78,529. Similarly, the statistical analysis conducted on geographies consisting of 377,100,109 people shows a moderate negative correlation between the proportion of Immigrants from Guatemala and median household income in the United States with a correlation coefficient (R) of -0.475 and weighted average of $75,123, a difference of 4.5%.
Median Household Income Correlation Summary
| Measurement | Sudanese | Immigrants from Guatemala |
| Minimum | $28,750 | $23,564 |
| Maximum | $150,237 | $94,609 |
| Range | $121,487 | $71,045 |
| Mean | $71,874 | $62,757 |
| Median | $73,369 | $64,030 |
| Interquartile 25% (IQ1) | $61,639 | $53,313 |
| Interquartile 75% (IQ3) | $82,076 | $74,300 |
| Interquartile Range (IQR) | $20,437 | $20,987 |
| Standard Deviation (Sample) | $22,253 | $14,592 |
| Standard Deviation (Population) | $22,086 | $14,488 |
Similar Demographics by Median Household Income
Demographics Similar to Sudanese by Median Household Income
In terms of median household income, the demographic groups most similar to Sudanese are West Indian ($78,455, a difference of 0.090%), Immigrants from Burma/Myanmar ($78,682, a difference of 0.19%), Immigrants from Laos ($78,327, a difference of 0.26%), Central American ($78,803, a difference of 0.35%), and Inupiat ($78,841, a difference of 0.40%).
| Demographics | Rating | Rank | Median Household Income |
| Immigrants | Nonimmigrants | 2.6 /100 | #241 | Tragic $79,429 |
| Immigrants | Sudan | 2.1 /100 | #242 | Tragic $79,103 |
| Immigrants | Barbados | 1.9 /100 | #243 | Tragic $78,989 |
| Marshallese | 1.9 /100 | #244 | Tragic $78,930 |
| Inupiat | 1.8 /100 | #245 | Tragic $78,841 |
| Central Americans | 1.7 /100 | #246 | Tragic $78,803 |
| Immigrants | Burma/Myanmar | 1.6 /100 | #247 | Tragic $78,682 |
| Sudanese | 1.5 /100 | #248 | Tragic $78,529 |
| West Indians | 1.4 /100 | #249 | Tragic $78,455 |
| Immigrants | Laos | 1.3 /100 | #250 | Tragic $78,327 |
| Mexican American Indians | 1.2 /100 | #251 | Tragic $78,166 |
| Immigrants | West Indies | 1.0 /100 | #252 | Tragic $77,956 |
| Immigrants | St. Vincent and the Grenadines | 0.9 /100 | #253 | Tragic $77,690 |
| Sub-Saharan Africans | 0.8 /100 | #254 | Tragic $77,631 |
| Immigrants | Middle Africa | 0.8 /100 | #255 | Tragic $77,559 |
Demographics Similar to Immigrants from Guatemala by Median Household Income
In terms of median household income, the demographic groups most similar to Immigrants from Guatemala are Osage ($75,240, a difference of 0.16%), Senegalese ($74,999, a difference of 0.16%), Immigrants from Liberia ($74,896, a difference of 0.30%), Spanish American ($75,386, a difference of 0.35%), and Central American Indian ($74,847, a difference of 0.37%).
| Demographics | Rating | Rank | Median Household Income |
| Somalis | 0.3 /100 | #272 | Tragic $75,782 |
| Liberians | 0.2 /100 | #273 | Tragic $75,667 |
| British West Indians | 0.2 /100 | #274 | Tragic $75,647 |
| Immigrants | Micronesia | 0.2 /100 | #275 | Tragic $75,574 |
| Immigrants | Latin America | 0.2 /100 | #276 | Tragic $75,420 |
| Spanish Americans | 0.2 /100 | #277 | Tragic $75,386 |
| Osage | 0.2 /100 | #278 | Tragic $75,240 |
| Immigrants | Guatemala | 0.2 /100 | #279 | Tragic $75,123 |
| Senegalese | 0.2 /100 | #280 | Tragic $74,999 |
| Immigrants | Liberia | 0.1 /100 | #281 | Tragic $74,896 |
| Central American Indians | 0.1 /100 | #282 | Tragic $74,847 |
| Cree | 0.1 /100 | #283 | Tragic $74,685 |
| Yaqui | 0.1 /100 | #284 | Tragic $74,596 |
| Mexicans | 0.1 /100 | #285 | Tragic $74,399 |
| Immigrants | Somalia | 0.1 /100 | #286 | Tragic $74,300 |