Sudanese vs Latvian Median Household Income
COMPARE
Sudanese
Latvian
Median Household Income
Median Household Income Comparison
Sudanese
Latvians
$78,529
MEDIAN HOUSEHOLD INCOME
1.5/ 100
METRIC RATING
248th/ 347
METRIC RANK
$97,311
MEDIAN HOUSEHOLD INCOME
100.0/ 100
METRIC RATING
37th/ 347
METRIC RANK
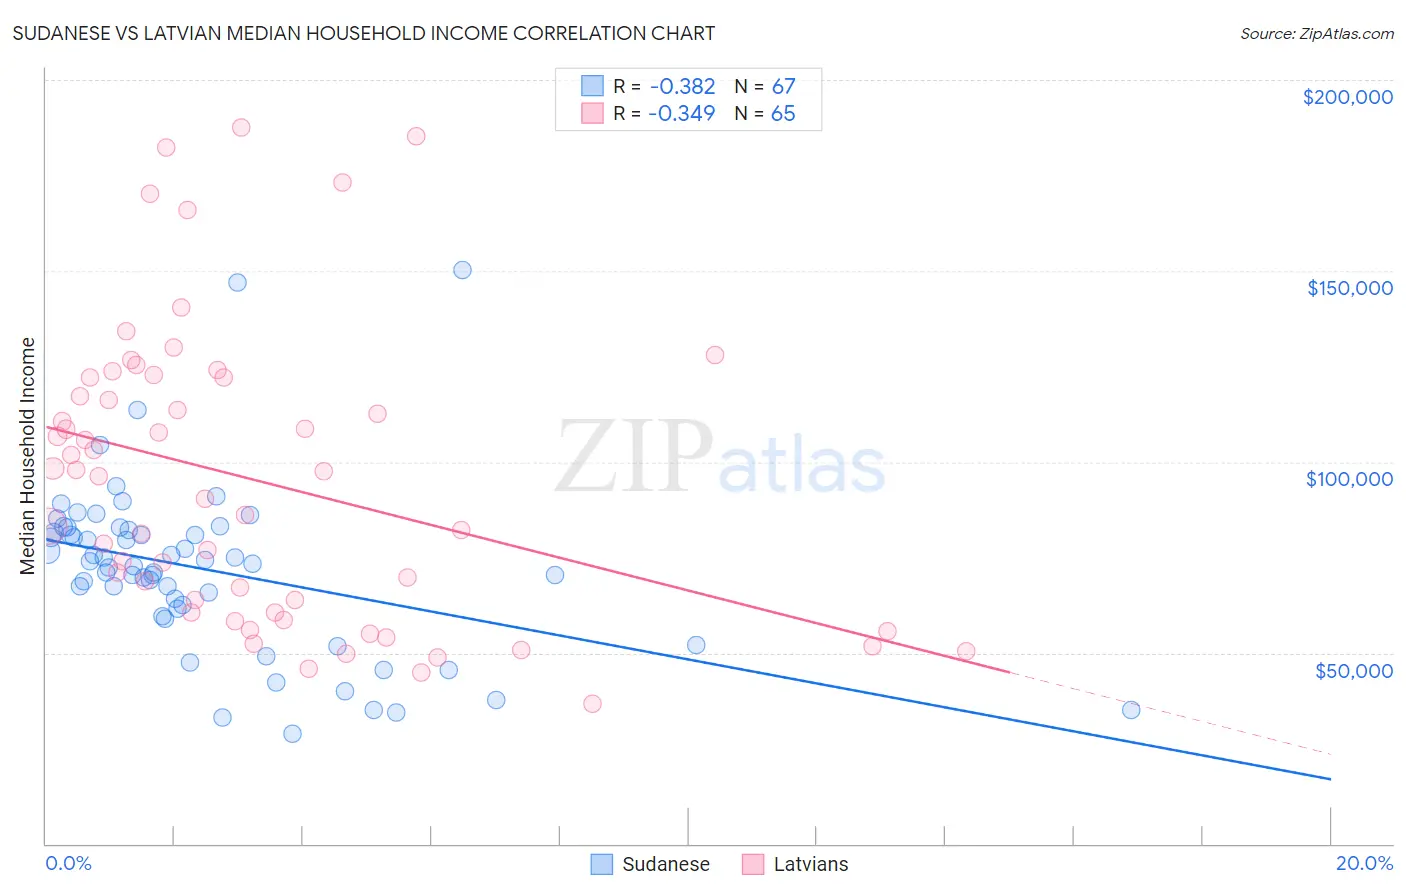
Sudanese vs Latvian Median Household Income Correlation Chart
The statistical analysis conducted on geographies consisting of 110,096,720 people shows a mild negative correlation between the proportion of Sudanese and median household income in the United States with a correlation coefficient (R) of -0.382 and weighted average of $78,529. Similarly, the statistical analysis conducted on geographies consisting of 220,635,560 people shows a mild negative correlation between the proportion of Latvians and median household income in the United States with a correlation coefficient (R) of -0.349 and weighted average of $97,311, a difference of 23.9%.
Median Household Income Correlation Summary
| Measurement | Sudanese | Latvian |
| Minimum | $28,750 | $36,528 |
| Maximum | $150,237 | $187,593 |
| Range | $121,487 | $151,065 |
| Mean | $71,874 | $95,169 |
| Median | $73,369 | $96,299 |
| Interquartile 25% (IQ1) | $61,639 | $60,583 |
| Interquartile 75% (IQ3) | $82,076 | $122,068 |
| Interquartile Range (IQR) | $20,437 | $61,485 |
| Standard Deviation (Sample) | $22,253 | $38,310 |
| Standard Deviation (Population) | $22,086 | $38,014 |
Similar Demographics by Median Household Income
Demographics Similar to Sudanese by Median Household Income
In terms of median household income, the demographic groups most similar to Sudanese are West Indian ($78,455, a difference of 0.090%), Immigrants from Burma/Myanmar ($78,682, a difference of 0.19%), Immigrants from Laos ($78,327, a difference of 0.26%), Central American ($78,803, a difference of 0.35%), and Inupiat ($78,841, a difference of 0.40%).
| Demographics | Rating | Rank | Median Household Income |
| Immigrants | Nonimmigrants | 2.6 /100 | #241 | Tragic $79,429 |
| Immigrants | Sudan | 2.1 /100 | #242 | Tragic $79,103 |
| Immigrants | Barbados | 1.9 /100 | #243 | Tragic $78,989 |
| Marshallese | 1.9 /100 | #244 | Tragic $78,930 |
| Inupiat | 1.8 /100 | #245 | Tragic $78,841 |
| Central Americans | 1.7 /100 | #246 | Tragic $78,803 |
| Immigrants | Burma/Myanmar | 1.6 /100 | #247 | Tragic $78,682 |
| Sudanese | 1.5 /100 | #248 | Tragic $78,529 |
| West Indians | 1.4 /100 | #249 | Tragic $78,455 |
| Immigrants | Laos | 1.3 /100 | #250 | Tragic $78,327 |
| Mexican American Indians | 1.2 /100 | #251 | Tragic $78,166 |
| Immigrants | West Indies | 1.0 /100 | #252 | Tragic $77,956 |
| Immigrants | St. Vincent and the Grenadines | 0.9 /100 | #253 | Tragic $77,690 |
| Sub-Saharan Africans | 0.8 /100 | #254 | Tragic $77,631 |
| Immigrants | Middle Africa | 0.8 /100 | #255 | Tragic $77,559 |
Demographics Similar to Latvians by Median Household Income
In terms of median household income, the demographic groups most similar to Latvians are Immigrants from Indonesia ($97,297, a difference of 0.010%), Immigrants from Pakistan ($97,528, a difference of 0.22%), Afghan ($97,026, a difference of 0.29%), Maltese ($97,015, a difference of 0.31%), and Immigrants from Turkey ($96,964, a difference of 0.36%).
| Demographics | Rating | Rank | Median Household Income |
| Immigrants | Northern Europe | 100.0 /100 | #30 | Exceptional $99,813 |
| Turks | 100.0 /100 | #31 | Exceptional $99,389 |
| Immigrants | Denmark | 100.0 /100 | #32 | Exceptional $98,510 |
| Chinese | 100.0 /100 | #33 | Exceptional $98,496 |
| Russians | 100.0 /100 | #34 | Exceptional $98,008 |
| Immigrants | Switzerland | 100.0 /100 | #35 | Exceptional $97,979 |
| Immigrants | Pakistan | 100.0 /100 | #36 | Exceptional $97,528 |
| Latvians | 100.0 /100 | #37 | Exceptional $97,311 |
| Immigrants | Indonesia | 100.0 /100 | #38 | Exceptional $97,297 |
| Afghans | 100.0 /100 | #39 | Exceptional $97,026 |
| Maltese | 100.0 /100 | #40 | Exceptional $97,015 |
| Immigrants | Turkey | 100.0 /100 | #41 | Exceptional $96,964 |
| Immigrants | Lithuania | 99.9 /100 | #42 | Exceptional $96,836 |
| Immigrants | France | 99.9 /100 | #43 | Exceptional $96,743 |
| Immigrants | Greece | 99.9 /100 | #44 | Exceptional $96,675 |