Sudanese vs Inupiat Median Household Income
COMPARE
Sudanese
Inupiat
Median Household Income
Median Household Income Comparison
Sudanese
Inupiat
$78,529
MEDIAN HOUSEHOLD INCOME
1.5/ 100
METRIC RATING
248th/ 347
METRIC RANK
$78,841
MEDIAN HOUSEHOLD INCOME
1.8/ 100
METRIC RATING
245th/ 347
METRIC RANK
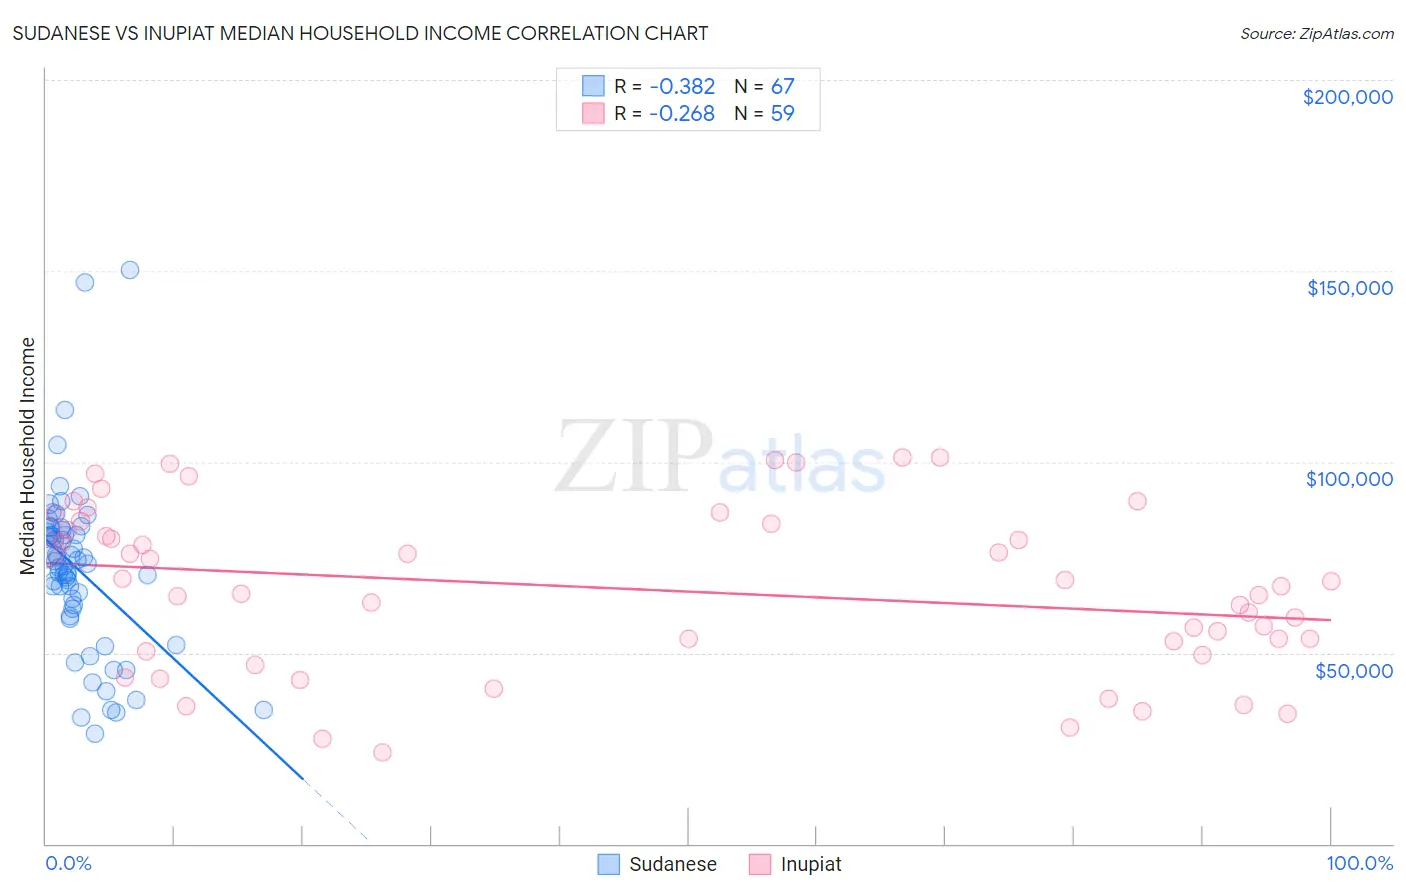
Sudanese vs Inupiat Median Household Income Correlation Chart
The statistical analysis conducted on geographies consisting of 110,096,720 people shows a mild negative correlation between the proportion of Sudanese and median household income in the United States with a correlation coefficient (R) of -0.382 and weighted average of $78,529. Similarly, the statistical analysis conducted on geographies consisting of 96,314,941 people shows a weak negative correlation between the proportion of Inupiat and median household income in the United States with a correlation coefficient (R) of -0.268 and weighted average of $78,841, a difference of 0.40%.
Median Household Income Correlation Summary
| Measurement | Sudanese | Inupiat |
| Minimum | $28,750 | $23,889 |
| Maximum | $150,237 | $101,071 |
| Range | $121,487 | $77,182 |
| Mean | $71,874 | $66,659 |
| Median | $73,369 | $67,500 |
| Interquartile 25% (IQ1) | $61,639 | $50,572 |
| Interquartile 75% (IQ3) | $82,076 | $83,750 |
| Interquartile Range (IQR) | $20,437 | $33,178 |
| Standard Deviation (Sample) | $22,253 | $21,353 |
| Standard Deviation (Population) | $22,086 | $21,171 |
Demographics Similar to Sudanese and Inupiat by Median Household Income
In terms of median household income, the demographic groups most similar to Sudanese are West Indian ($78,455, a difference of 0.090%), Immigrants from Burma/Myanmar ($78,682, a difference of 0.19%), Immigrants from Laos ($78,327, a difference of 0.26%), Central American ($78,803, a difference of 0.35%), and Mexican American Indian ($78,166, a difference of 0.46%). Similarly, the demographic groups most similar to Inupiat are Central American ($78,803, a difference of 0.050%), Marshallese ($78,930, a difference of 0.11%), Immigrants from Barbados ($78,989, a difference of 0.19%), Immigrants from Burma/Myanmar ($78,682, a difference of 0.20%), and Immigrants from Sudan ($79,103, a difference of 0.33%).
| Demographics | Rating | Rank | Median Household Income |
| Immigrants | Bosnia and Herzegovina | 3.4 /100 | #236 | Tragic $79,888 |
| Nicaraguans | 3.1 /100 | #237 | Tragic $79,737 |
| Barbadians | 3.0 /100 | #238 | Tragic $79,664 |
| Alaska Natives | 2.7 /100 | #239 | Tragic $79,509 |
| Immigrants | Western Africa | 2.7 /100 | #240 | Tragic $79,490 |
| Immigrants | Nonimmigrants | 2.6 /100 | #241 | Tragic $79,429 |
| Immigrants | Sudan | 2.1 /100 | #242 | Tragic $79,103 |
| Immigrants | Barbados | 1.9 /100 | #243 | Tragic $78,989 |
| Marshallese | 1.9 /100 | #244 | Tragic $78,930 |
| Inupiat | 1.8 /100 | #245 | Tragic $78,841 |
| Central Americans | 1.7 /100 | #246 | Tragic $78,803 |
| Immigrants | Burma/Myanmar | 1.6 /100 | #247 | Tragic $78,682 |
| Sudanese | 1.5 /100 | #248 | Tragic $78,529 |
| West Indians | 1.4 /100 | #249 | Tragic $78,455 |
| Immigrants | Laos | 1.3 /100 | #250 | Tragic $78,327 |
| Mexican American Indians | 1.2 /100 | #251 | Tragic $78,166 |
| Immigrants | West Indies | 1.0 /100 | #252 | Tragic $77,956 |
| Immigrants | St. Vincent and the Grenadines | 0.9 /100 | #253 | Tragic $77,690 |
| Sub-Saharan Africans | 0.8 /100 | #254 | Tragic $77,631 |
| Immigrants | Middle Africa | 0.8 /100 | #255 | Tragic $77,559 |
| Belizeans | 0.6 /100 | #256 | Tragic $77,028 |