Macedonian vs Puget Sound Salish Median Household Income
COMPARE
Macedonian
Puget Sound Salish
Median Household Income
Median Household Income Comparison
Macedonians
Puget Sound Salish
$90,761
MEDIAN HOUSEHOLD INCOME
97.4/ 100
METRIC RATING
106th/ 347
METRIC RANK
$84,011
MEDIAN HOUSEHOLD INCOME
33.2/ 100
METRIC RATING
186th/ 347
METRIC RANK
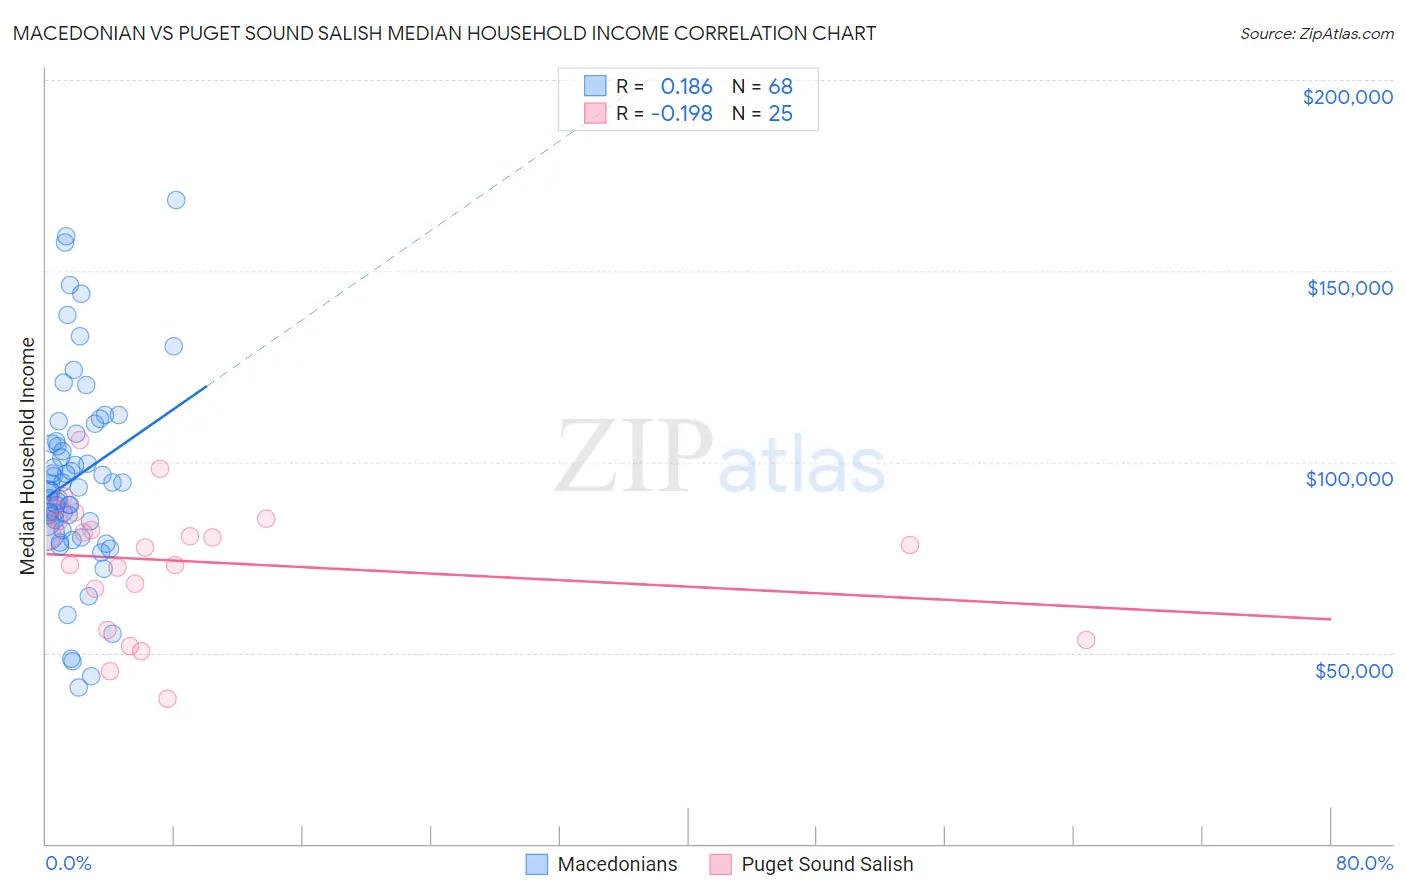
Macedonian vs Puget Sound Salish Median Household Income Correlation Chart
The statistical analysis conducted on geographies consisting of 132,580,342 people shows a poor positive correlation between the proportion of Macedonians and median household income in the United States with a correlation coefficient (R) of 0.186 and weighted average of $90,761. Similarly, the statistical analysis conducted on geographies consisting of 46,152,941 people shows a poor negative correlation between the proportion of Puget Sound Salish and median household income in the United States with a correlation coefficient (R) of -0.198 and weighted average of $84,011, a difference of 8.0%.
Median Household Income Correlation Summary
| Measurement | Macedonian | Puget Sound Salish |
| Minimum | $40,833 | $37,964 |
| Maximum | $168,448 | $105,684 |
| Range | $127,615 | $67,720 |
| Mean | $96,021 | $73,927 |
| Median | $93,863 | $78,333 |
| Interquartile 25% (IQ1) | $83,085 | $61,302 |
| Interquartile 75% (IQ3) | $106,377 | $84,790 |
| Interquartile Range (IQR) | $23,292 | $23,488 |
| Standard Deviation (Sample) | $25,740 | $16,803 |
| Standard Deviation (Population) | $25,550 | $16,464 |
Similar Demographics by Median Household Income
Demographics Similar to Macedonians by Median Household Income
In terms of median household income, the demographic groups most similar to Macedonians are Croatian ($90,685, a difference of 0.080%), Immigrants from Brazil ($90,907, a difference of 0.16%), Zimbabwean ($90,618, a difference of 0.16%), Chilean ($90,605, a difference of 0.17%), and Palestinian ($90,574, a difference of 0.21%).
| Demographics | Rating | Rank | Median Household Income |
| Immigrants | South Eastern Asia | 98.4 /100 | #99 | Exceptional $91,541 |
| Ukrainians | 98.3 /100 | #100 | Exceptional $91,456 |
| Immigrants | Moldova | 98.3 /100 | #101 | Exceptional $91,446 |
| Austrians | 98.2 /100 | #102 | Exceptional $91,339 |
| Immigrants | Ukraine | 98.0 /100 | #103 | Exceptional $91,124 |
| Immigrants | Kazakhstan | 97.8 /100 | #104 | Exceptional $91,015 |
| Immigrants | Brazil | 97.7 /100 | #105 | Exceptional $90,907 |
| Macedonians | 97.4 /100 | #106 | Exceptional $90,761 |
| Croatians | 97.3 /100 | #107 | Exceptional $90,685 |
| Zimbabweans | 97.2 /100 | #108 | Exceptional $90,618 |
| Chileans | 97.2 /100 | #109 | Exceptional $90,605 |
| Palestinians | 97.1 /100 | #110 | Exceptional $90,574 |
| Immigrants | Poland | 97.1 /100 | #111 | Exceptional $90,549 |
| Northern Europeans | 96.9 /100 | #112 | Exceptional $90,446 |
| Peruvians | 96.5 /100 | #113 | Exceptional $90,261 |
Demographics Similar to Puget Sound Salish by Median Household Income
In terms of median household income, the demographic groups most similar to Puget Sound Salish are Belgian ($84,008, a difference of 0.0%), Tlingit-Haida ($83,968, a difference of 0.050%), Kenyan ($84,085, a difference of 0.090%), Immigrants from Colombia ($83,902, a difference of 0.13%), and Slovak ($83,798, a difference of 0.25%).
| Demographics | Rating | Rank | Median Household Income |
| English | 47.0 /100 | #179 | Average $84,915 |
| Immigrants | Portugal | 44.2 /100 | #180 | Average $84,740 |
| Hawaiians | 44.1 /100 | #181 | Average $84,729 |
| Uruguayans | 43.5 /100 | #182 | Average $84,691 |
| Spaniards | 42.7 /100 | #183 | Average $84,644 |
| Immigrants | Eastern Africa | 37.4 /100 | #184 | Fair $84,299 |
| Kenyans | 34.2 /100 | #185 | Fair $84,085 |
| Puget Sound Salish | 33.2 /100 | #186 | Fair $84,011 |
| Belgians | 33.2 /100 | #187 | Fair $84,008 |
| Tlingit-Haida | 32.6 /100 | #188 | Fair $83,968 |
| Immigrants | Colombia | 31.7 /100 | #189 | Fair $83,902 |
| Slovaks | 30.2 /100 | #190 | Fair $83,798 |
| Iraqis | 29.6 /100 | #191 | Fair $83,753 |
| Welsh | 28.0 /100 | #192 | Fair $83,628 |
| Finns | 27.7 /100 | #193 | Fair $83,607 |