Sudanese vs Immigrants from Bolivia Median Household Income
COMPARE
Sudanese
Immigrants from Bolivia
Median Household Income
Median Household Income Comparison
Sudanese
Immigrants from Bolivia
$78,529
MEDIAN HOUSEHOLD INCOME
1.5/ 100
METRIC RATING
248th/ 347
METRIC RANK
$101,394
MEDIAN HOUSEHOLD INCOME
100.0/ 100
METRIC RATING
23rd/ 347
METRIC RANK
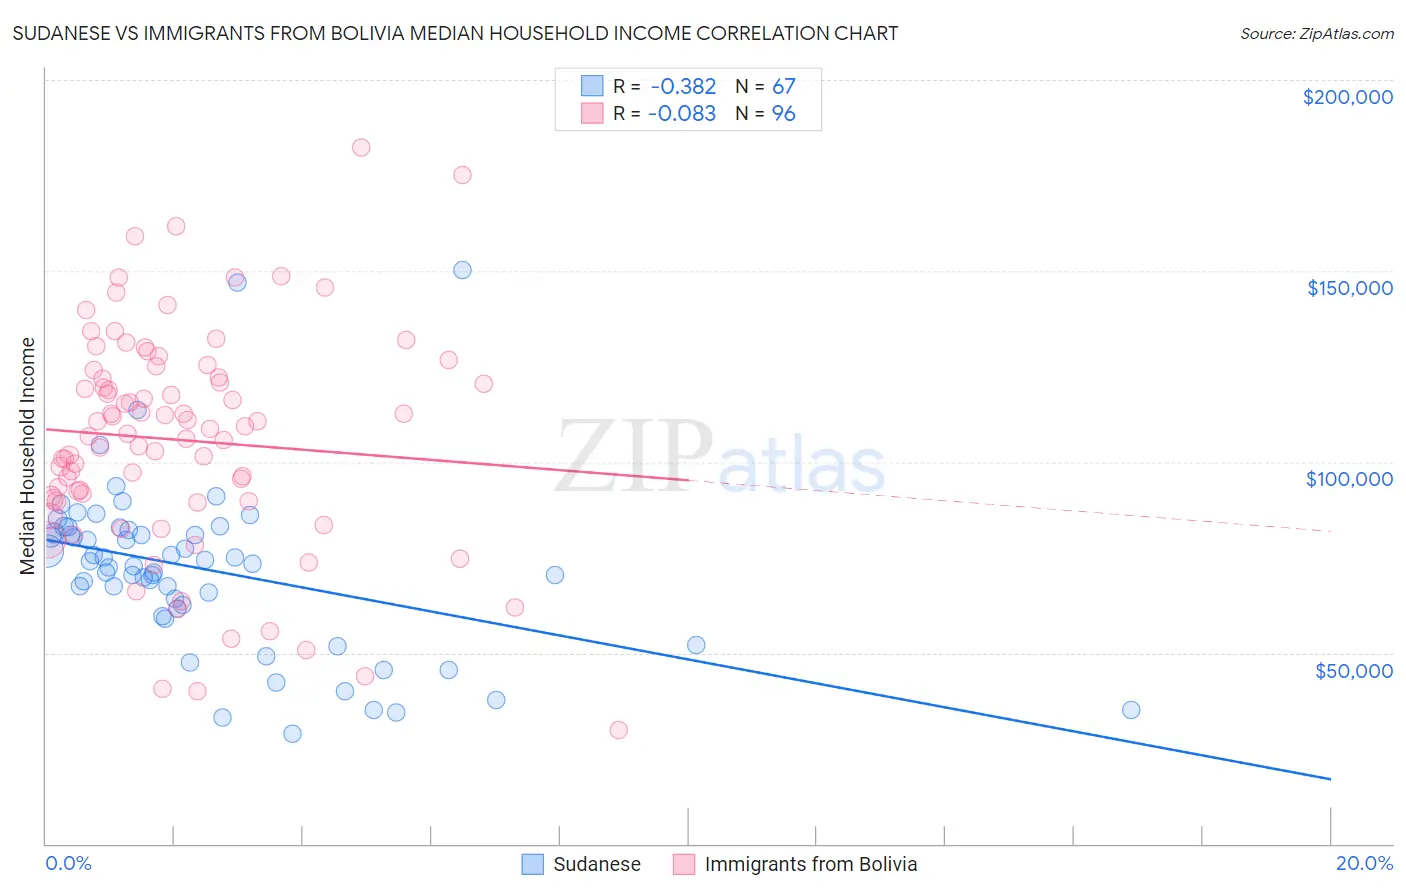
Sudanese vs Immigrants from Bolivia Median Household Income Correlation Chart
The statistical analysis conducted on geographies consisting of 110,096,720 people shows a mild negative correlation between the proportion of Sudanese and median household income in the United States with a correlation coefficient (R) of -0.382 and weighted average of $78,529. Similarly, the statistical analysis conducted on geographies consisting of 158,713,567 people shows a slight negative correlation between the proportion of Immigrants from Bolivia and median household income in the United States with a correlation coefficient (R) of -0.083 and weighted average of $101,394, a difference of 29.1%.
Median Household Income Correlation Summary
| Measurement | Sudanese | Immigrants from Bolivia |
| Minimum | $28,750 | $29,844 |
| Maximum | $150,237 | $182,250 |
| Range | $121,487 | $152,406 |
| Mean | $71,874 | $105,682 |
| Median | $73,369 | $107,900 |
| Interquartile 25% (IQ1) | $61,639 | $89,971 |
| Interquartile 75% (IQ3) | $82,076 | $123,106 |
| Interquartile Range (IQR) | $20,437 | $33,135 |
| Standard Deviation (Sample) | $22,253 | $29,190 |
| Standard Deviation (Population) | $22,086 | $29,037 |
Similar Demographics by Median Household Income
Demographics Similar to Sudanese by Median Household Income
In terms of median household income, the demographic groups most similar to Sudanese are West Indian ($78,455, a difference of 0.090%), Immigrants from Burma/Myanmar ($78,682, a difference of 0.19%), Immigrants from Laos ($78,327, a difference of 0.26%), Central American ($78,803, a difference of 0.35%), and Inupiat ($78,841, a difference of 0.40%).
| Demographics | Rating | Rank | Median Household Income |
| Immigrants | Nonimmigrants | 2.6 /100 | #241 | Tragic $79,429 |
| Immigrants | Sudan | 2.1 /100 | #242 | Tragic $79,103 |
| Immigrants | Barbados | 1.9 /100 | #243 | Tragic $78,989 |
| Marshallese | 1.9 /100 | #244 | Tragic $78,930 |
| Inupiat | 1.8 /100 | #245 | Tragic $78,841 |
| Central Americans | 1.7 /100 | #246 | Tragic $78,803 |
| Immigrants | Burma/Myanmar | 1.6 /100 | #247 | Tragic $78,682 |
| Sudanese | 1.5 /100 | #248 | Tragic $78,529 |
| West Indians | 1.4 /100 | #249 | Tragic $78,455 |
| Immigrants | Laos | 1.3 /100 | #250 | Tragic $78,327 |
| Mexican American Indians | 1.2 /100 | #251 | Tragic $78,166 |
| Immigrants | West Indies | 1.0 /100 | #252 | Tragic $77,956 |
| Immigrants | St. Vincent and the Grenadines | 0.9 /100 | #253 | Tragic $77,690 |
| Sub-Saharan Africans | 0.8 /100 | #254 | Tragic $77,631 |
| Immigrants | Middle Africa | 0.8 /100 | #255 | Tragic $77,559 |
Demographics Similar to Immigrants from Bolivia by Median Household Income
In terms of median household income, the demographic groups most similar to Immigrants from Bolivia are Asian ($101,681, a difference of 0.28%), Eastern European ($101,781, a difference of 0.38%), Immigrants from Japan ($100,711, a difference of 0.68%), Immigrants from Sweden ($100,699, a difference of 0.69%), and Bolivian ($102,195, a difference of 0.79%).
| Demographics | Rating | Rank | Median Household Income |
| Burmese | 100.0 /100 | #16 | Exceptional $103,145 |
| Immigrants | Korea | 100.0 /100 | #17 | Exceptional $102,962 |
| Cypriots | 100.0 /100 | #18 | Exceptional $102,843 |
| Immigrants | Australia | 100.0 /100 | #19 | Exceptional $102,562 |
| Bolivians | 100.0 /100 | #20 | Exceptional $102,195 |
| Eastern Europeans | 100.0 /100 | #21 | Exceptional $101,781 |
| Asians | 100.0 /100 | #22 | Exceptional $101,681 |
| Immigrants | Bolivia | 100.0 /100 | #23 | Exceptional $101,394 |
| Immigrants | Japan | 100.0 /100 | #24 | Exceptional $100,711 |
| Immigrants | Sweden | 100.0 /100 | #25 | Exceptional $100,699 |
| Immigrants | Belgium | 100.0 /100 | #26 | Exceptional $100,306 |
| Bhutanese | 100.0 /100 | #27 | Exceptional $100,151 |
| Immigrants | Sri Lanka | 100.0 /100 | #28 | Exceptional $99,943 |
| Immigrants | Asia | 100.0 /100 | #29 | Exceptional $99,933 |
| Immigrants | Northern Europe | 100.0 /100 | #30 | Exceptional $99,813 |