Sudanese vs Ugandan Median Household Income
COMPARE
Sudanese
Ugandan
Median Household Income
Median Household Income Comparison
Sudanese
Ugandans
$78,529
MEDIAN HOUSEHOLD INCOME
1.5/ 100
METRIC RATING
248th/ 347
METRIC RANK
$87,557
MEDIAN HOUSEHOLD INCOME
82.9/ 100
METRIC RATING
145th/ 347
METRIC RANK
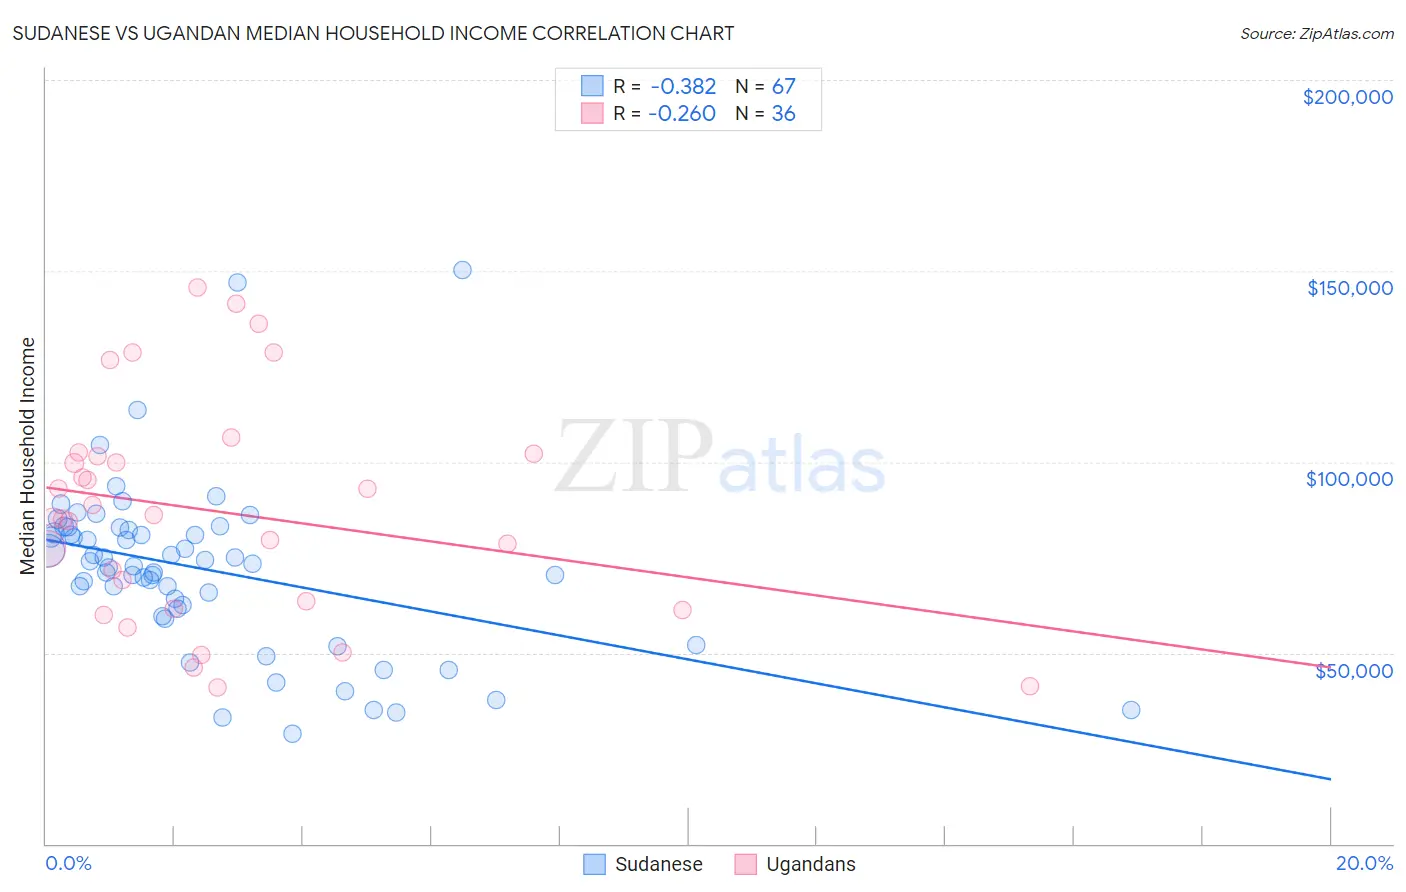
Sudanese vs Ugandan Median Household Income Correlation Chart
The statistical analysis conducted on geographies consisting of 110,096,720 people shows a mild negative correlation between the proportion of Sudanese and median household income in the United States with a correlation coefficient (R) of -0.382 and weighted average of $78,529. Similarly, the statistical analysis conducted on geographies consisting of 93,988,402 people shows a weak negative correlation between the proportion of Ugandans and median household income in the United States with a correlation coefficient (R) of -0.260 and weighted average of $87,557, a difference of 11.5%.
Median Household Income Correlation Summary
| Measurement | Sudanese | Ugandan |
| Minimum | $28,750 | $40,977 |
| Maximum | $150,237 | $145,769 |
| Range | $121,487 | $104,792 |
| Mean | $71,874 | $87,043 |
| Median | $73,369 | $85,898 |
| Interquartile 25% (IQ1) | $61,639 | $62,590 |
| Interquartile 75% (IQ3) | $82,076 | $101,783 |
| Interquartile Range (IQR) | $20,437 | $39,193 |
| Standard Deviation (Sample) | $22,253 | $28,515 |
| Standard Deviation (Population) | $22,086 | $28,116 |
Similar Demographics by Median Household Income
Demographics Similar to Sudanese by Median Household Income
In terms of median household income, the demographic groups most similar to Sudanese are West Indian ($78,455, a difference of 0.090%), Immigrants from Burma/Myanmar ($78,682, a difference of 0.19%), Immigrants from Laos ($78,327, a difference of 0.26%), Central American ($78,803, a difference of 0.35%), and Inupiat ($78,841, a difference of 0.40%).
| Demographics | Rating | Rank | Median Household Income |
| Immigrants | Nonimmigrants | 2.6 /100 | #241 | Tragic $79,429 |
| Immigrants | Sudan | 2.1 /100 | #242 | Tragic $79,103 |
| Immigrants | Barbados | 1.9 /100 | #243 | Tragic $78,989 |
| Marshallese | 1.9 /100 | #244 | Tragic $78,930 |
| Inupiat | 1.8 /100 | #245 | Tragic $78,841 |
| Central Americans | 1.7 /100 | #246 | Tragic $78,803 |
| Immigrants | Burma/Myanmar | 1.6 /100 | #247 | Tragic $78,682 |
| Sudanese | 1.5 /100 | #248 | Tragic $78,529 |
| West Indians | 1.4 /100 | #249 | Tragic $78,455 |
| Immigrants | Laos | 1.3 /100 | #250 | Tragic $78,327 |
| Mexican American Indians | 1.2 /100 | #251 | Tragic $78,166 |
| Immigrants | West Indies | 1.0 /100 | #252 | Tragic $77,956 |
| Immigrants | St. Vincent and the Grenadines | 0.9 /100 | #253 | Tragic $77,690 |
| Sub-Saharan Africans | 0.8 /100 | #254 | Tragic $77,631 |
| Immigrants | Middle Africa | 0.8 /100 | #255 | Tragic $77,559 |
Demographics Similar to Ugandans by Median Household Income
In terms of median household income, the demographic groups most similar to Ugandans are Immigrants from Uganda ($87,553, a difference of 0.0%), Serbian ($87,572, a difference of 0.020%), South American Indian ($87,446, a difference of 0.13%), Danish ($87,676, a difference of 0.14%), and Canadian ($87,769, a difference of 0.24%).
| Demographics | Rating | Rank | Median Household Income |
| Arabs | 89.2 /100 | #138 | Excellent $88,398 |
| Immigrants | Chile | 89.2 /100 | #139 | Excellent $88,388 |
| Lebanese | 87.2 /100 | #140 | Excellent $88,091 |
| Immigrants | Morocco | 86.0 /100 | #141 | Excellent $87,930 |
| Canadians | 84.7 /100 | #142 | Excellent $87,769 |
| Danes | 83.9 /100 | #143 | Excellent $87,676 |
| Serbians | 83.0 /100 | #144 | Excellent $87,572 |
| Ugandans | 82.9 /100 | #145 | Excellent $87,557 |
| Immigrants | Uganda | 82.8 /100 | #146 | Excellent $87,553 |
| South American Indians | 81.8 /100 | #147 | Excellent $87,446 |
| Costa Ricans | 80.0 /100 | #148 | Excellent $87,262 |
| Immigrants | Nepal | 77.7 /100 | #149 | Good $87,046 |
| Basques | 77.2 /100 | #150 | Good $87,001 |
| Hungarians | 76.3 /100 | #151 | Good $86,920 |
| Immigrants | Saudi Arabia | 75.8 /100 | #152 | Good $86,875 |