Spanish vs Bangladeshi Wage/Income Gap
COMPARE
Spanish
Bangladeshi
Wage/Income Gap
Wage/Income Gap Comparison
Spanish
Bangladeshis
27.1%
WAGE/INCOME GAP
3.6/ 100
METRIC RATING
243rd/ 347
METRIC RANK
22.2%
WAGE/INCOME GAP
100.0/ 100
METRIC RATING
53rd/ 347
METRIC RANK
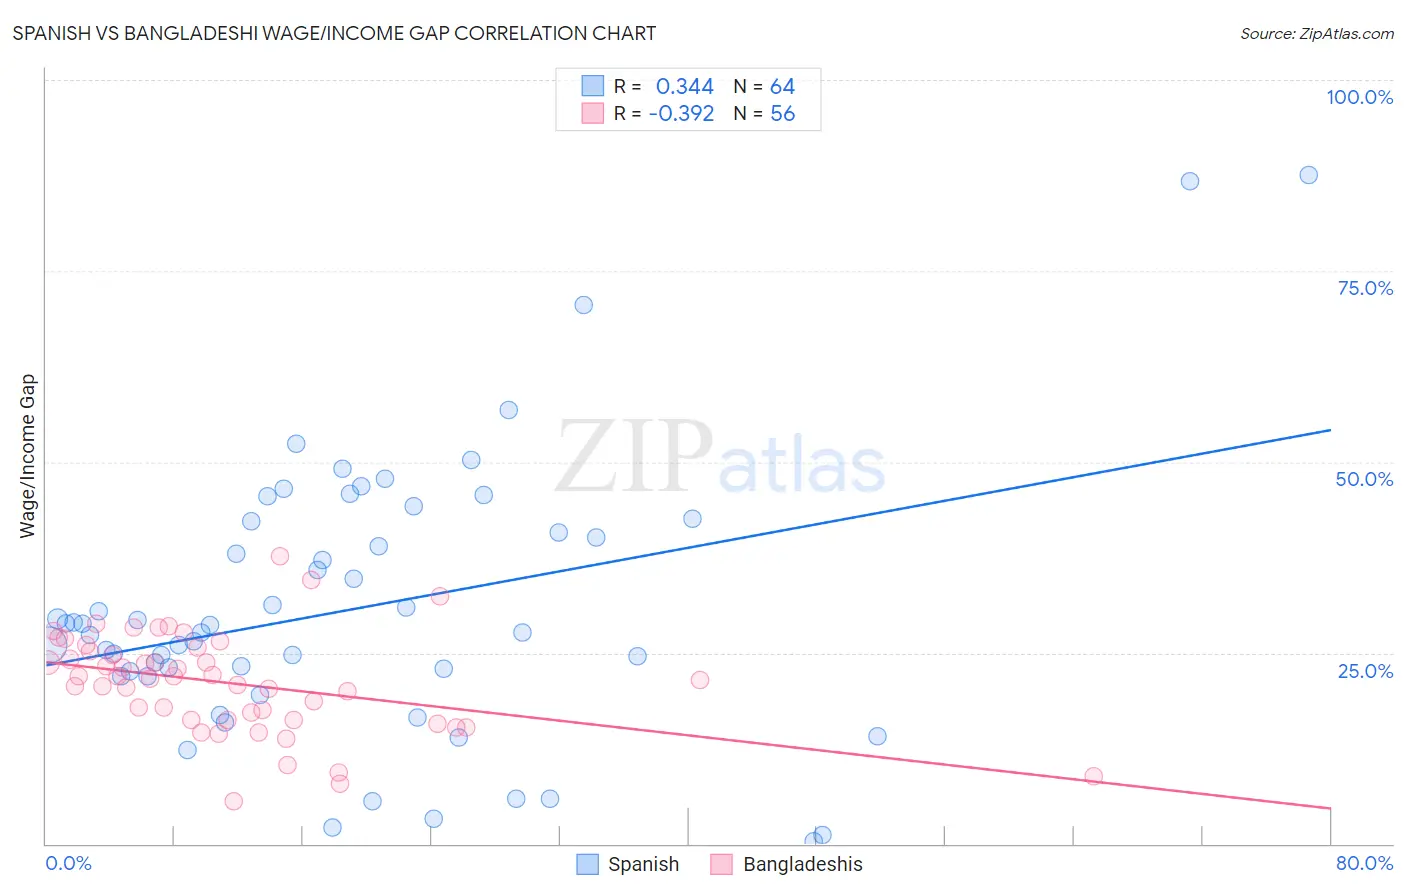
Spanish vs Bangladeshi Wage/Income Gap Correlation Chart
The statistical analysis conducted on geographies consisting of 421,731,243 people shows a mild positive correlation between the proportion of Spanish and wage/income gap percentage in the United States with a correlation coefficient (R) of 0.344 and weighted average of 27.1%. Similarly, the statistical analysis conducted on geographies consisting of 141,421,838 people shows a mild negative correlation between the proportion of Bangladeshis and wage/income gap percentage in the United States with a correlation coefficient (R) of -0.392 and weighted average of 22.2%, a difference of 22.5%.
Wage/Income Gap Correlation Summary
| Measurement | Spanish | Bangladeshi |
| Minimum | 0.38% | 5.5% |
| Maximum | 87.5% | 37.6% |
| Range | 87.2% | 32.1% |
| Mean | 30.8% | 21.1% |
| Median | 28.1% | 21.8% |
| Interquartile 25% (IQ1) | 22.3% | 16.2% |
| Interquartile 75% (IQ3) | 41.5% | 25.4% |
| Interquartile Range (IQR) | 19.1% | 9.2% |
| Standard Deviation (Sample) | 17.7% | 6.5% |
| Standard Deviation (Population) | 17.6% | 6.5% |
Similar Demographics by Wage/Income Gap
Demographics Similar to Spanish by Wage/Income Gap
In terms of wage/income gap, the demographic groups most similar to Spanish are Immigrants from Sri Lanka (27.1%, a difference of 0.010%), Creek (27.1%, a difference of 0.060%), Chickasaw (27.2%, a difference of 0.070%), Immigrants from Europe (27.1%, a difference of 0.080%), and Immigrants from the Azores (27.2%, a difference of 0.090%).
| Demographics | Rating | Rank | Wage/Income Gap |
| Immigrants | Romania | 4.8 /100 | #236 | Tragic 27.0% |
| Immigrants | Eastern Asia | 4.4 /100 | #237 | Tragic 27.1% |
| Osage | 4.4 /100 | #238 | Tragic 27.1% |
| Estonians | 4.3 /100 | #239 | Tragic 27.1% |
| Immigrants | Europe | 3.8 /100 | #240 | Tragic 27.1% |
| Creek | 3.8 /100 | #241 | Tragic 27.1% |
| Immigrants | Sri Lanka | 3.7 /100 | #242 | Tragic 27.1% |
| Spanish | 3.6 /100 | #243 | Tragic 27.1% |
| Chickasaw | 3.5 /100 | #244 | Tragic 27.2% |
| Immigrants | Azores | 3.5 /100 | #245 | Tragic 27.2% |
| Immigrants | Nonimmigrants | 3.3 /100 | #246 | Tragic 27.2% |
| Celtics | 2.8 /100 | #247 | Tragic 27.3% |
| Cypriots | 2.8 /100 | #248 | Tragic 27.3% |
| Carpatho Rusyns | 2.7 /100 | #249 | Tragic 27.3% |
| Immigrants | Czechoslovakia | 2.7 /100 | #250 | Tragic 27.3% |
Demographics Similar to Bangladeshis by Wage/Income Gap
In terms of wage/income gap, the demographic groups most similar to Bangladeshis are Immigrants from Cameroon (22.2%, a difference of 0.010%), Tohono O'odham (22.1%, a difference of 0.10%), Nepalese (22.2%, a difference of 0.23%), Immigrants from Western Africa (22.0%, a difference of 0.53%), and Immigrants from Zaire (22.3%, a difference of 0.63%).
| Demographics | Rating | Rank | Wage/Income Gap |
| Immigrants | Ethiopia | 100.0 /100 | #46 | Exceptional 21.6% |
| Immigrants | Congo | 100.0 /100 | #47 | Exceptional 21.7% |
| Blacks/African Americans | 100.0 /100 | #48 | Exceptional 21.7% |
| Ethiopians | 100.0 /100 | #49 | Exceptional 21.8% |
| Immigrants | Western Africa | 100.0 /100 | #50 | Exceptional 22.0% |
| Tohono O'odham | 100.0 /100 | #51 | Exceptional 22.1% |
| Immigrants | Cameroon | 100.0 /100 | #52 | Exceptional 22.2% |
| Bangladeshis | 100.0 /100 | #53 | Exceptional 22.2% |
| Nepalese | 100.0 /100 | #54 | Exceptional 22.2% |
| Immigrants | Zaire | 100.0 /100 | #55 | Exceptional 22.3% |
| Immigrants | Ghana | 100.0 /100 | #56 | Exceptional 22.3% |
| Ghanaians | 100.0 /100 | #57 | Exceptional 22.3% |
| Immigrants | Cuba | 100.0 /100 | #58 | Exceptional 22.4% |
| Navajo | 100.0 /100 | #59 | Exceptional 22.4% |
| Immigrants | Middle Africa | 100.0 /100 | #60 | Exceptional 22.4% |