Spanish vs Bangladeshi Single Female Poverty
COMPARE
Spanish
Bangladeshi
Single Female Poverty
Single Female Poverty Comparison
Spanish
Bangladeshis
22.0%
SINGLE FEMALE POVERTY
4.7/ 100
METRIC RATING
234th/ 347
METRIC RANK
24.2%
SINGLE FEMALE POVERTY
0.0/ 100
METRIC RATING
287th/ 347
METRIC RANK
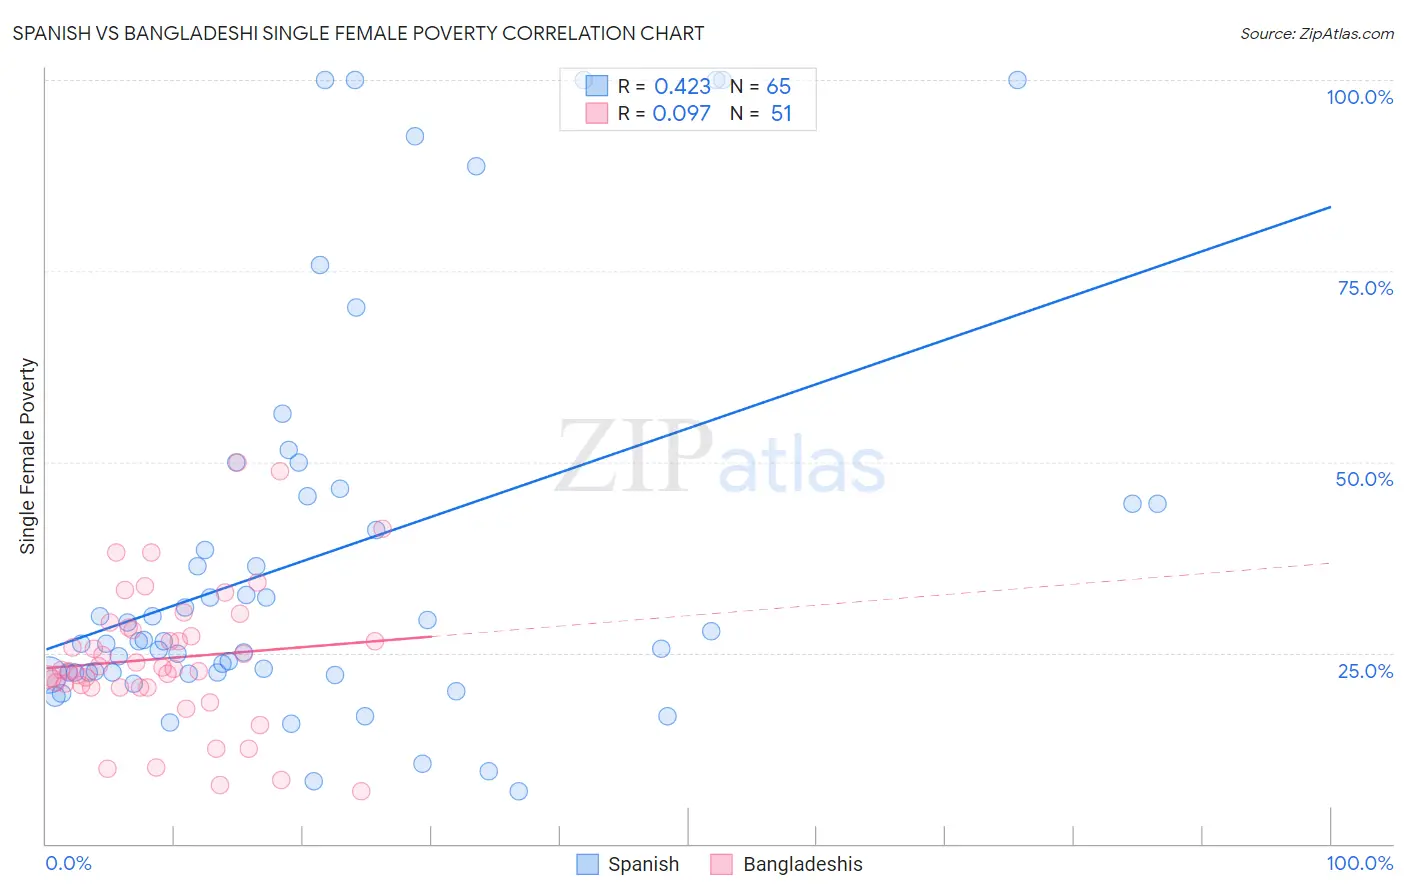
Spanish vs Bangladeshi Single Female Poverty Correlation Chart
The statistical analysis conducted on geographies consisting of 415,535,670 people shows a moderate positive correlation between the proportion of Spanish and poverty level among single females in the United States with a correlation coefficient (R) of 0.423 and weighted average of 22.0%. Similarly, the statistical analysis conducted on geographies consisting of 140,594,140 people shows a slight positive correlation between the proportion of Bangladeshis and poverty level among single females in the United States with a correlation coefficient (R) of 0.097 and weighted average of 24.2%, a difference of 9.9%.
Single Female Poverty Correlation Summary
| Measurement | Spanish | Bangladeshi |
| Minimum | 6.8% | 6.9% |
| Maximum | 100.0% | 50.0% |
| Range | 93.2% | 43.1% |
| Mean | 37.7% | 24.3% |
| Median | 26.5% | 22.9% |
| Interquartile 25% (IQ1) | 22.4% | 20.5% |
| Interquartile 75% (IQ3) | 45.0% | 28.3% |
| Interquartile Range (IQR) | 22.6% | 7.8% |
| Standard Deviation (Sample) | 26.1% | 9.2% |
| Standard Deviation (Population) | 25.9% | 9.1% |
Similar Demographics by Single Female Poverty
Demographics Similar to Spanish by Single Female Poverty
In terms of single female poverty, the demographic groups most similar to Spanish are Spaniard (22.0%, a difference of 0.0%), Dutch (22.0%, a difference of 0.020%), Immigrants from Thailand (22.0%, a difference of 0.10%), Welsh (22.0%, a difference of 0.11%), and Immigrants from Ecuador (22.0%, a difference of 0.18%).
| Demographics | Rating | Rank | Single Female Poverty |
| Immigrants | Ghana | 5.8 /100 | #227 | Tragic 21.9% |
| Salvadorans | 5.5 /100 | #228 | Tragic 21.9% |
| Tlingit-Haida | 5.4 /100 | #229 | Tragic 21.9% |
| Immigrants | Western Africa | 5.3 /100 | #230 | Tragic 22.0% |
| Welsh | 5.0 /100 | #231 | Tragic 22.0% |
| Immigrants | Thailand | 5.0 /100 | #232 | Tragic 22.0% |
| Spaniards | 4.7 /100 | #233 | Tragic 22.0% |
| Spanish | 4.7 /100 | #234 | Tragic 22.0% |
| Dutch | 4.6 /100 | #235 | Tragic 22.0% |
| Immigrants | Ecuador | 4.2 /100 | #236 | Tragic 22.0% |
| Vietnamese | 4.0 /100 | #237 | Tragic 22.0% |
| French Canadians | 2.8 /100 | #238 | Tragic 22.2% |
| Malaysians | 2.8 /100 | #239 | Tragic 22.2% |
| French | 2.3 /100 | #240 | Tragic 22.2% |
| Cape Verdeans | 2.1 /100 | #241 | Tragic 22.3% |
Demographics Similar to Bangladeshis by Single Female Poverty
In terms of single female poverty, the demographic groups most similar to Bangladeshis are Spanish American (24.2%, a difference of 0.020%), U.S. Virgin Islander (24.2%, a difference of 0.070%), Cree (24.1%, a difference of 0.15%), Immigrants from Guatemala (24.1%, a difference of 0.19%), and Indonesian (24.3%, a difference of 0.41%).
| Demographics | Rating | Rank | Single Female Poverty |
| Immigrants | Latin America | 0.0 /100 | #280 | Tragic 23.7% |
| Immigrants | Zaire | 0.0 /100 | #281 | Tragic 23.8% |
| Guatemalans | 0.0 /100 | #282 | Tragic 23.8% |
| German Russians | 0.0 /100 | #283 | Tragic 23.9% |
| Immigrants | Dominica | 0.0 /100 | #284 | Tragic 23.9% |
| Immigrants | Guatemala | 0.0 /100 | #285 | Tragic 24.1% |
| Cree | 0.0 /100 | #286 | Tragic 24.1% |
| Bangladeshis | 0.0 /100 | #287 | Tragic 24.2% |
| Spanish Americans | 0.0 /100 | #288 | Tragic 24.2% |
| U.S. Virgin Islanders | 0.0 /100 | #289 | Tragic 24.2% |
| Indonesians | 0.0 /100 | #290 | Tragic 24.3% |
| Osage | 0.0 /100 | #291 | Tragic 24.4% |
| Alsatians | 0.0 /100 | #292 | Tragic 24.5% |
| Americans | 0.0 /100 | #293 | Tragic 24.5% |
| French American Indians | 0.0 /100 | #294 | Tragic 24.6% |