Spanish vs Colombian Wage/Income Gap
COMPARE
Spanish
Colombian
Wage/Income Gap
Wage/Income Gap Comparison
Spanish
Colombians
27.1%
WAGE/INCOME GAP
3.6/ 100
METRIC RATING
243rd/ 347
METRIC RANK
24.7%
WAGE/INCOME GAP
92.4/ 100
METRIC RATING
133rd/ 347
METRIC RANK
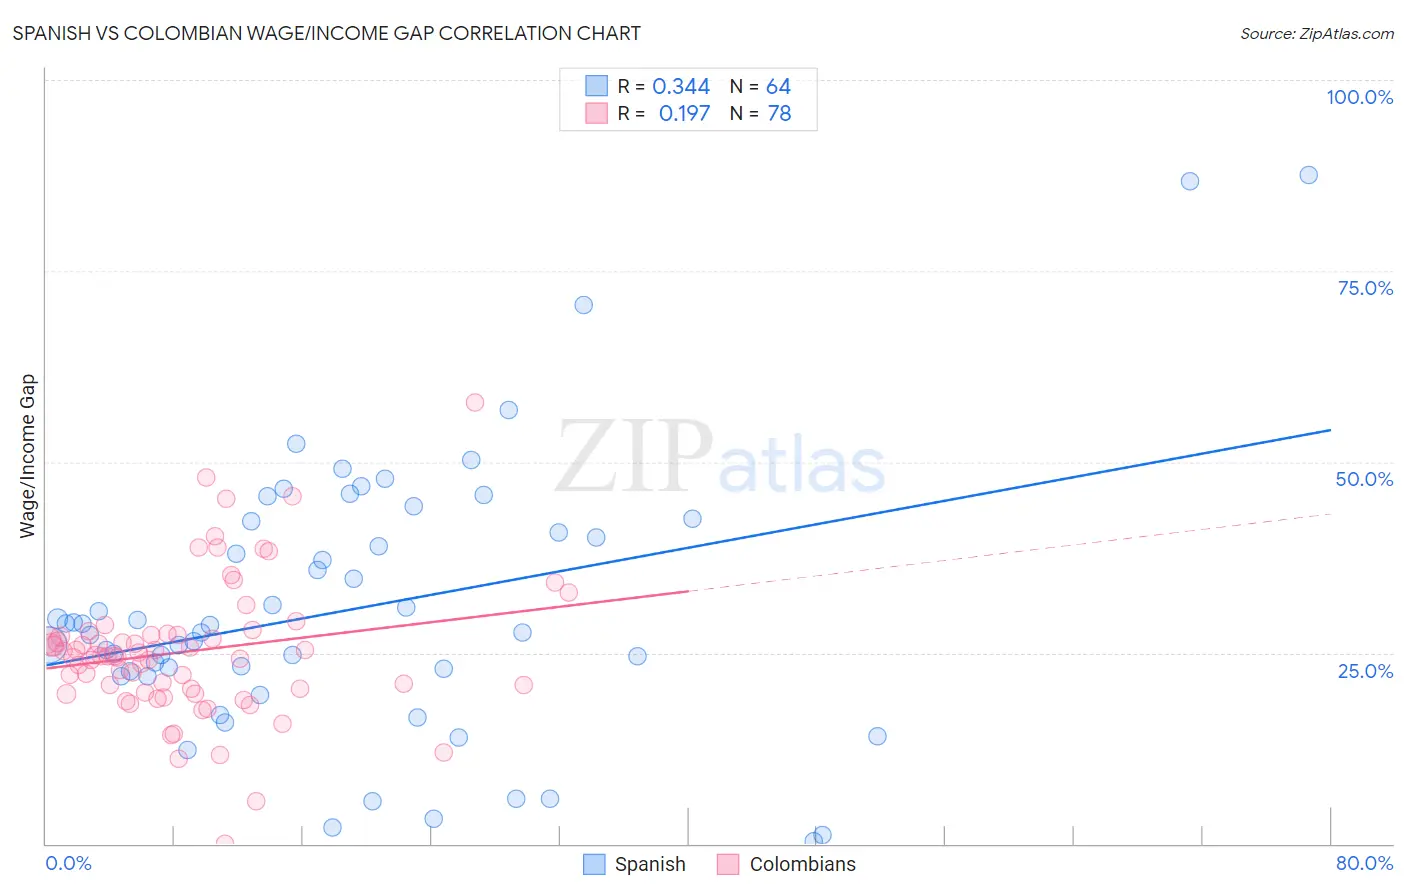
Spanish vs Colombian Wage/Income Gap Correlation Chart
The statistical analysis conducted on geographies consisting of 421,731,243 people shows a mild positive correlation between the proportion of Spanish and wage/income gap percentage in the United States with a correlation coefficient (R) of 0.344 and weighted average of 27.1%. Similarly, the statistical analysis conducted on geographies consisting of 419,429,082 people shows a poor positive correlation between the proportion of Colombians and wage/income gap percentage in the United States with a correlation coefficient (R) of 0.197 and weighted average of 24.7%, a difference of 9.8%.
Wage/Income Gap Correlation Summary
| Measurement | Spanish | Colombian |
| Minimum | 0.38% | 0.074% |
| Maximum | 87.5% | 57.8% |
| Range | 87.2% | 57.8% |
| Mean | 30.8% | 25.2% |
| Median | 28.1% | 24.6% |
| Interquartile 25% (IQ1) | 22.3% | 20.3% |
| Interquartile 75% (IQ3) | 41.5% | 27.4% |
| Interquartile Range (IQR) | 19.1% | 7.1% |
| Standard Deviation (Sample) | 17.7% | 9.1% |
| Standard Deviation (Population) | 17.6% | 9.0% |
Similar Demographics by Wage/Income Gap
Demographics Similar to Spanish by Wage/Income Gap
In terms of wage/income gap, the demographic groups most similar to Spanish are Immigrants from Sri Lanka (27.1%, a difference of 0.010%), Creek (27.1%, a difference of 0.060%), Chickasaw (27.2%, a difference of 0.070%), Immigrants from Europe (27.1%, a difference of 0.080%), and Immigrants from the Azores (27.2%, a difference of 0.090%).
| Demographics | Rating | Rank | Wage/Income Gap |
| Immigrants | Romania | 4.8 /100 | #236 | Tragic 27.0% |
| Immigrants | Eastern Asia | 4.4 /100 | #237 | Tragic 27.1% |
| Osage | 4.4 /100 | #238 | Tragic 27.1% |
| Estonians | 4.3 /100 | #239 | Tragic 27.1% |
| Immigrants | Europe | 3.8 /100 | #240 | Tragic 27.1% |
| Creek | 3.8 /100 | #241 | Tragic 27.1% |
| Immigrants | Sri Lanka | 3.7 /100 | #242 | Tragic 27.1% |
| Spanish | 3.6 /100 | #243 | Tragic 27.1% |
| Chickasaw | 3.5 /100 | #244 | Tragic 27.2% |
| Immigrants | Azores | 3.5 /100 | #245 | Tragic 27.2% |
| Immigrants | Nonimmigrants | 3.3 /100 | #246 | Tragic 27.2% |
| Celtics | 2.8 /100 | #247 | Tragic 27.3% |
| Cypriots | 2.8 /100 | #248 | Tragic 27.3% |
| Carpatho Rusyns | 2.7 /100 | #249 | Tragic 27.3% |
| Immigrants | Czechoslovakia | 2.7 /100 | #250 | Tragic 27.3% |
Demographics Similar to Colombians by Wage/Income Gap
In terms of wage/income gap, the demographic groups most similar to Colombians are Immigrants from Costa Rica (24.7%, a difference of 0.0%), Mexican American Indian (24.7%, a difference of 0.030%), South American Indian (24.7%, a difference of 0.090%), Immigrants from Philippines (24.7%, a difference of 0.15%), and Alsatian (24.7%, a difference of 0.22%).
| Demographics | Rating | Rank | Wage/Income Gap |
| Immigrants | Uruguay | 93.8 /100 | #126 | Exceptional 24.6% |
| German Russians | 93.7 /100 | #127 | Exceptional 24.6% |
| Immigrants | Central America | 93.5 /100 | #128 | Exceptional 24.6% |
| Yup'ik | 93.3 /100 | #129 | Exceptional 24.7% |
| Alsatians | 93.2 /100 | #130 | Exceptional 24.7% |
| Immigrants | Philippines | 93.0 /100 | #131 | Exceptional 24.7% |
| Immigrants | Costa Rica | 92.4 /100 | #132 | Exceptional 24.7% |
| Colombians | 92.4 /100 | #133 | Exceptional 24.7% |
| Mexican American Indians | 92.2 /100 | #134 | Exceptional 24.7% |
| South American Indians | 92.0 /100 | #135 | Exceptional 24.7% |
| Armenians | 91.3 /100 | #136 | Exceptional 24.8% |
| Immigrants | South Eastern Asia | 90.9 /100 | #137 | Exceptional 24.8% |
| Immigrants | Bosnia and Herzegovina | 90.1 /100 | #138 | Exceptional 24.8% |
| Hispanics or Latinos | 89.5 /100 | #139 | Excellent 24.9% |
| Immigrants | Nepal | 89.3 /100 | #140 | Excellent 24.9% |