Soviet Union vs Tohono O'odham Wage/Income Gap
COMPARE
Soviet Union
Tohono O'odham
Wage/Income Gap
Wage/Income Gap Comparison
Soviet Union
Tohono O'odham
24.2%
WAGE/INCOME GAP
97.6/ 100
METRIC RATING
111th/ 347
METRIC RANK
22.1%
WAGE/INCOME GAP
100.0/ 100
METRIC RATING
51st/ 347
METRIC RANK
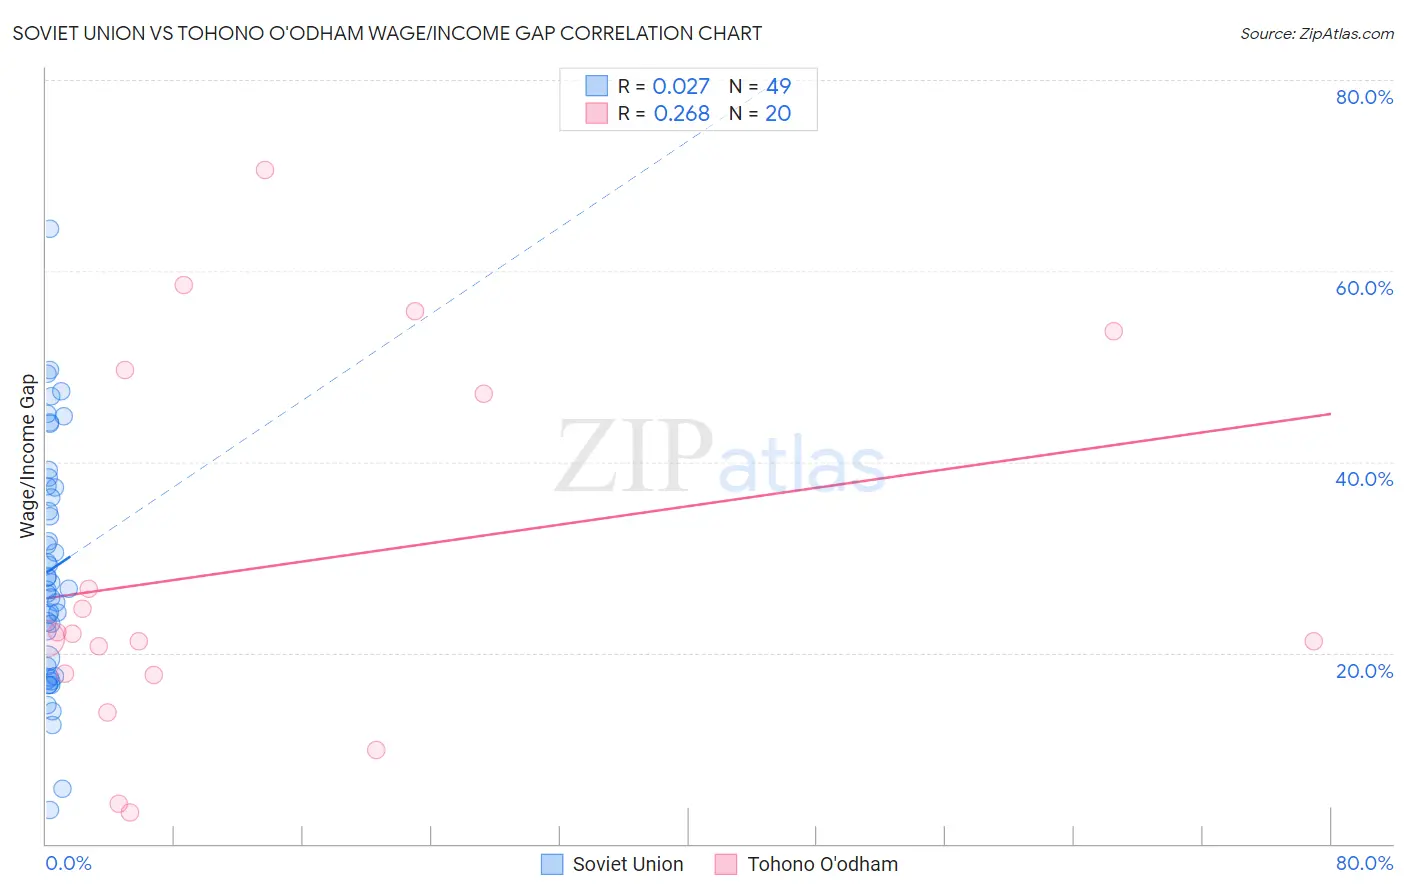
Soviet Union vs Tohono O'odham Wage/Income Gap Correlation Chart
The statistical analysis conducted on geographies consisting of 43,506,320 people shows no correlation between the proportion of Soviet Union and wage/income gap percentage in the United States with a correlation coefficient (R) of 0.027 and weighted average of 24.2%. Similarly, the statistical analysis conducted on geographies consisting of 58,710,489 people shows a weak positive correlation between the proportion of Tohono O'odham and wage/income gap percentage in the United States with a correlation coefficient (R) of 0.268 and weighted average of 22.1%, a difference of 9.3%.
Wage/Income Gap Correlation Summary
| Measurement | Soviet Union | Tohono O'odham |
| Minimum | 3.5% | 3.3% |
| Maximum | 64.4% | 70.6% |
| Range | 60.9% | 67.3% |
| Mean | 28.7% | 29.1% |
| Median | 26.8% | 21.8% |
| Interquartile 25% (IQ1) | 18.1% | 17.8% |
| Interquartile 75% (IQ3) | 37.4% | 48.4% |
| Interquartile Range (IQR) | 19.3% | 30.7% |
| Standard Deviation (Sample) | 12.5% | 19.4% |
| Standard Deviation (Population) | 12.4% | 19.0% |
Similar Demographics by Wage/Income Gap
Demographics Similar to Soviet Union by Wage/Income Gap
In terms of wage/income gap, the demographic groups most similar to Soviet Union are Immigrants from Colombia (24.3%, a difference of 0.40%), Immigrants from Morocco (24.1%, a difference of 0.44%), Sioux (24.3%, a difference of 0.45%), Panamanian (24.4%, a difference of 0.65%), and Ugandan (24.1%, a difference of 0.66%).
| Demographics | Rating | Rank | Wage/Income Gap |
| Tlingit-Haida | 98.7 /100 | #104 | Exceptional 24.0% |
| Moroccans | 98.6 /100 | #105 | Exceptional 24.0% |
| Sudanese | 98.6 /100 | #106 | Exceptional 24.0% |
| Yaqui | 98.4 /100 | #107 | Exceptional 24.0% |
| Immigrants | Albania | 98.4 /100 | #108 | Exceptional 24.0% |
| Ugandans | 98.3 /100 | #109 | Exceptional 24.1% |
| Immigrants | Morocco | 98.1 /100 | #110 | Exceptional 24.1% |
| Soviet Union | 97.6 /100 | #111 | Exceptional 24.2% |
| Immigrants | Colombia | 97.0 /100 | #112 | Exceptional 24.3% |
| Sioux | 96.9 /100 | #113 | Exceptional 24.3% |
| Panamanians | 96.5 /100 | #114 | Exceptional 24.4% |
| Immigrants | Kenya | 96.4 /100 | #115 | Exceptional 24.4% |
| Alaska Natives | 96.0 /100 | #116 | Exceptional 24.4% |
| Immigrants | Afghanistan | 95.9 /100 | #117 | Exceptional 24.4% |
| Immigrants | Micronesia | 95.8 /100 | #118 | Exceptional 24.4% |
Demographics Similar to Tohono O'odham by Wage/Income Gap
In terms of wage/income gap, the demographic groups most similar to Tohono O'odham are Immigrants from Cameroon (22.2%, a difference of 0.080%), Bangladeshi (22.2%, a difference of 0.10%), Nepalese (22.2%, a difference of 0.32%), Immigrants from Western Africa (22.0%, a difference of 0.44%), and Immigrants from Zaire (22.3%, a difference of 0.72%).
| Demographics | Rating | Rank | Wage/Income Gap |
| Immigrants | Eritrea | 100.0 /100 | #44 | Exceptional 21.4% |
| U.S. Virgin Islanders | 100.0 /100 | #45 | Exceptional 21.5% |
| Immigrants | Ethiopia | 100.0 /100 | #46 | Exceptional 21.6% |
| Immigrants | Congo | 100.0 /100 | #47 | Exceptional 21.7% |
| Blacks/African Americans | 100.0 /100 | #48 | Exceptional 21.7% |
| Ethiopians | 100.0 /100 | #49 | Exceptional 21.8% |
| Immigrants | Western Africa | 100.0 /100 | #50 | Exceptional 22.0% |
| Tohono O'odham | 100.0 /100 | #51 | Exceptional 22.1% |
| Immigrants | Cameroon | 100.0 /100 | #52 | Exceptional 22.2% |
| Bangladeshis | 100.0 /100 | #53 | Exceptional 22.2% |
| Nepalese | 100.0 /100 | #54 | Exceptional 22.2% |
| Immigrants | Zaire | 100.0 /100 | #55 | Exceptional 22.3% |
| Immigrants | Ghana | 100.0 /100 | #56 | Exceptional 22.3% |
| Ghanaians | 100.0 /100 | #57 | Exceptional 22.3% |
| Immigrants | Cuba | 100.0 /100 | #58 | Exceptional 22.4% |