Soviet Union vs Australian Wage/Income Gap
COMPARE
Soviet Union
Australian
Wage/Income Gap
Wage/Income Gap Comparison
Soviet Union
Australians
24.2%
WAGE/INCOME GAP
97.6/ 100
METRIC RATING
111th/ 347
METRIC RANK
28.2%
WAGE/INCOME GAP
0.3/ 100
METRIC RATING
290th/ 347
METRIC RANK
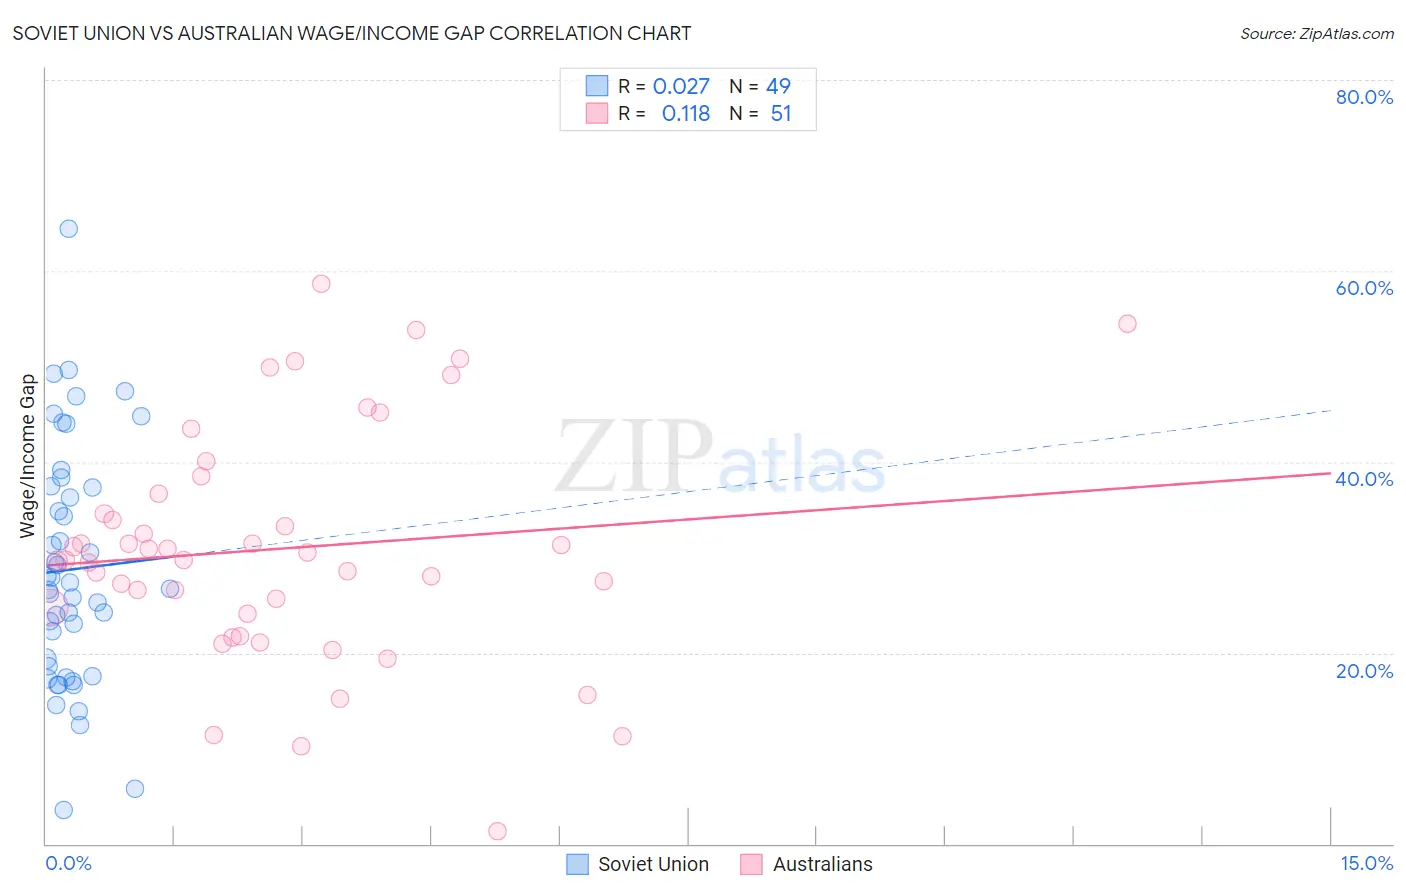
Soviet Union vs Australian Wage/Income Gap Correlation Chart
The statistical analysis conducted on geographies consisting of 43,506,320 people shows no correlation between the proportion of Soviet Union and wage/income gap percentage in the United States with a correlation coefficient (R) of 0.027 and weighted average of 24.2%. Similarly, the statistical analysis conducted on geographies consisting of 224,081,810 people shows a poor positive correlation between the proportion of Australians and wage/income gap percentage in the United States with a correlation coefficient (R) of 0.118 and weighted average of 28.2%, a difference of 16.4%.
Wage/Income Gap Correlation Summary
| Measurement | Soviet Union | Australian |
| Minimum | 3.5% | 1.3% |
| Maximum | 64.4% | 58.7% |
| Range | 60.9% | 57.4% |
| Mean | 28.7% | 30.9% |
| Median | 26.8% | 29.8% |
| Interquartile 25% (IQ1) | 18.1% | 24.1% |
| Interquartile 75% (IQ3) | 37.4% | 36.7% |
| Interquartile Range (IQR) | 19.3% | 12.6% |
| Standard Deviation (Sample) | 12.5% | 12.2% |
| Standard Deviation (Population) | 12.4% | 12.1% |
Similar Demographics by Wage/Income Gap
Demographics Similar to Soviet Union by Wage/Income Gap
In terms of wage/income gap, the demographic groups most similar to Soviet Union are Immigrants from Colombia (24.3%, a difference of 0.40%), Immigrants from Morocco (24.1%, a difference of 0.44%), Sioux (24.3%, a difference of 0.45%), Panamanian (24.4%, a difference of 0.65%), and Ugandan (24.1%, a difference of 0.66%).
| Demographics | Rating | Rank | Wage/Income Gap |
| Tlingit-Haida | 98.7 /100 | #104 | Exceptional 24.0% |
| Moroccans | 98.6 /100 | #105 | Exceptional 24.0% |
| Sudanese | 98.6 /100 | #106 | Exceptional 24.0% |
| Yaqui | 98.4 /100 | #107 | Exceptional 24.0% |
| Immigrants | Albania | 98.4 /100 | #108 | Exceptional 24.0% |
| Ugandans | 98.3 /100 | #109 | Exceptional 24.1% |
| Immigrants | Morocco | 98.1 /100 | #110 | Exceptional 24.1% |
| Soviet Union | 97.6 /100 | #111 | Exceptional 24.2% |
| Immigrants | Colombia | 97.0 /100 | #112 | Exceptional 24.3% |
| Sioux | 96.9 /100 | #113 | Exceptional 24.3% |
| Panamanians | 96.5 /100 | #114 | Exceptional 24.4% |
| Immigrants | Kenya | 96.4 /100 | #115 | Exceptional 24.4% |
| Alaska Natives | 96.0 /100 | #116 | Exceptional 24.4% |
| Immigrants | Afghanistan | 95.9 /100 | #117 | Exceptional 24.4% |
| Immigrants | Micronesia | 95.8 /100 | #118 | Exceptional 24.4% |
Demographics Similar to Australians by Wage/Income Gap
In terms of wage/income gap, the demographic groups most similar to Australians are Czechoslovakian (28.2%, a difference of 0.070%), Canadian (28.1%, a difference of 0.090%), Immigrants from Australia (28.2%, a difference of 0.12%), Choctaw (28.1%, a difference of 0.13%), and Okinawan (28.1%, a difference of 0.16%).
| Demographics | Rating | Rank | Wage/Income Gap |
| French Canadians | 0.4 /100 | #283 | Tragic 28.1% |
| Immigrants | Sweden | 0.4 /100 | #284 | Tragic 28.1% |
| Italians | 0.4 /100 | #285 | Tragic 28.1% |
| Immigrants | Austria | 0.4 /100 | #286 | Tragic 28.1% |
| Okinawans | 0.4 /100 | #287 | Tragic 28.1% |
| Choctaw | 0.4 /100 | #288 | Tragic 28.1% |
| Canadians | 0.3 /100 | #289 | Tragic 28.1% |
| Australians | 0.3 /100 | #290 | Tragic 28.2% |
| Czechoslovakians | 0.3 /100 | #291 | Tragic 28.2% |
| Immigrants | Australia | 0.3 /100 | #292 | Tragic 28.2% |
| Immigrants | Israel | 0.3 /100 | #293 | Tragic 28.2% |
| Greeks | 0.3 /100 | #294 | Tragic 28.2% |
| Slovenes | 0.3 /100 | #295 | Tragic 28.3% |
| Northern Europeans | 0.3 /100 | #296 | Tragic 28.3% |
| Immigrants | North America | 0.2 /100 | #297 | Tragic 28.4% |