Soviet Union vs Immigrants from Liberia Wage/Income Gap
COMPARE
Soviet Union
Immigrants from Liberia
Wage/Income Gap
Wage/Income Gap Comparison
Soviet Union
Immigrants from Liberia
24.2%
WAGE/INCOME GAP
97.6/ 100
METRIC RATING
111th/ 347
METRIC RANK
20.6%
WAGE/INCOME GAP
100.0/ 100
METRIC RATING
22nd/ 347
METRIC RANK
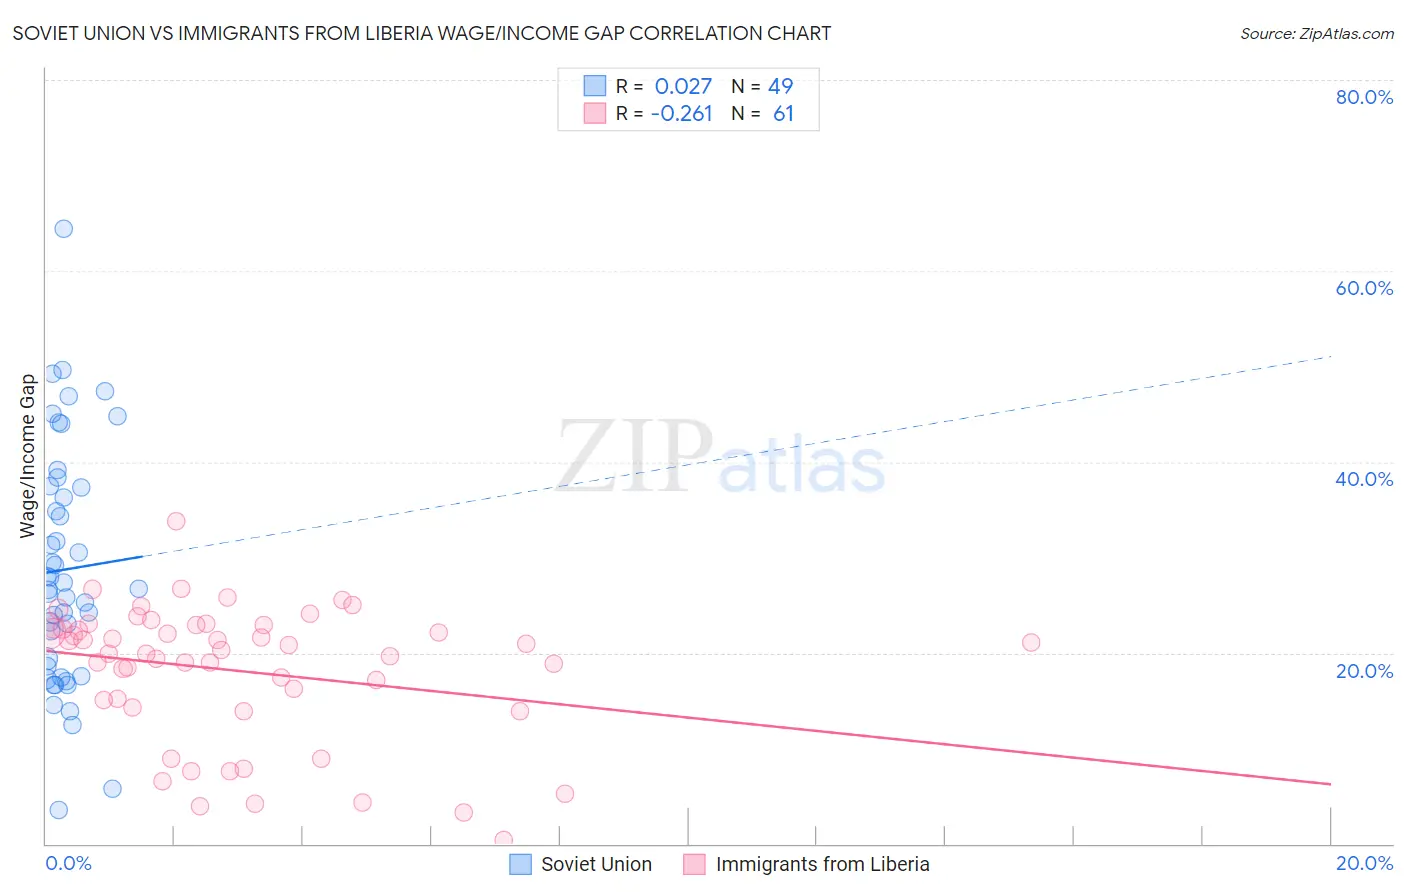
Soviet Union vs Immigrants from Liberia Wage/Income Gap Correlation Chart
The statistical analysis conducted on geographies consisting of 43,506,320 people shows no correlation between the proportion of Soviet Union and wage/income gap percentage in the United States with a correlation coefficient (R) of 0.027 and weighted average of 24.2%. Similarly, the statistical analysis conducted on geographies consisting of 135,262,187 people shows a weak negative correlation between the proportion of Immigrants from Liberia and wage/income gap percentage in the United States with a correlation coefficient (R) of -0.261 and weighted average of 20.6%, a difference of 17.8%.
Wage/Income Gap Correlation Summary
| Measurement | Soviet Union | Immigrants from Liberia |
| Minimum | 3.5% | 0.44% |
| Maximum | 64.4% | 33.8% |
| Range | 60.9% | 33.3% |
| Mean | 28.7% | 18.1% |
| Median | 26.8% | 20.2% |
| Interquartile 25% (IQ1) | 18.1% | 14.7% |
| Interquartile 75% (IQ3) | 37.4% | 22.8% |
| Interquartile Range (IQR) | 19.3% | 8.1% |
| Standard Deviation (Sample) | 12.5% | 7.1% |
| Standard Deviation (Population) | 12.4% | 7.1% |
Similar Demographics by Wage/Income Gap
Demographics Similar to Soviet Union by Wage/Income Gap
In terms of wage/income gap, the demographic groups most similar to Soviet Union are Immigrants from Colombia (24.3%, a difference of 0.40%), Immigrants from Morocco (24.1%, a difference of 0.44%), Sioux (24.3%, a difference of 0.45%), Panamanian (24.4%, a difference of 0.65%), and Ugandan (24.1%, a difference of 0.66%).
| Demographics | Rating | Rank | Wage/Income Gap |
| Tlingit-Haida | 98.7 /100 | #104 | Exceptional 24.0% |
| Moroccans | 98.6 /100 | #105 | Exceptional 24.0% |
| Sudanese | 98.6 /100 | #106 | Exceptional 24.0% |
| Yaqui | 98.4 /100 | #107 | Exceptional 24.0% |
| Immigrants | Albania | 98.4 /100 | #108 | Exceptional 24.0% |
| Ugandans | 98.3 /100 | #109 | Exceptional 24.1% |
| Immigrants | Morocco | 98.1 /100 | #110 | Exceptional 24.1% |
| Soviet Union | 97.6 /100 | #111 | Exceptional 24.2% |
| Immigrants | Colombia | 97.0 /100 | #112 | Exceptional 24.3% |
| Sioux | 96.9 /100 | #113 | Exceptional 24.3% |
| Panamanians | 96.5 /100 | #114 | Exceptional 24.4% |
| Immigrants | Kenya | 96.4 /100 | #115 | Exceptional 24.4% |
| Alaska Natives | 96.0 /100 | #116 | Exceptional 24.4% |
| Immigrants | Afghanistan | 95.9 /100 | #117 | Exceptional 24.4% |
| Immigrants | Micronesia | 95.8 /100 | #118 | Exceptional 24.4% |
Demographics Similar to Immigrants from Liberia by Wage/Income Gap
In terms of wage/income gap, the demographic groups most similar to Immigrants from Liberia are Immigrants from Dominican Republic (20.6%, a difference of 0.020%), Dominican (20.6%, a difference of 0.19%), Senegalese (20.7%, a difference of 0.49%), Pueblo (20.7%, a difference of 0.61%), and Immigrants from Caribbean (20.4%, a difference of 0.79%).
| Demographics | Rating | Rank | Wage/Income Gap |
| West Indians | 100.0 /100 | #15 | Exceptional 19.6% |
| Jamaicans | 100.0 /100 | #16 | Exceptional 19.6% |
| Haitians | 100.0 /100 | #17 | Exceptional 19.7% |
| Hopi | 100.0 /100 | #18 | Exceptional 20.0% |
| Immigrants | Dominica | 100.0 /100 | #19 | Exceptional 20.0% |
| Bahamians | 100.0 /100 | #20 | Exceptional 20.2% |
| Immigrants | Caribbean | 100.0 /100 | #21 | Exceptional 20.4% |
| Immigrants | Liberia | 100.0 /100 | #22 | Exceptional 20.6% |
| Immigrants | Dominican Republic | 100.0 /100 | #23 | Exceptional 20.6% |
| Dominicans | 100.0 /100 | #24 | Exceptional 20.6% |
| Senegalese | 100.0 /100 | #25 | Exceptional 20.7% |
| Pueblo | 100.0 /100 | #26 | Exceptional 20.7% |
| Immigrants | Armenia | 100.0 /100 | #27 | Exceptional 20.7% |
| Inupiat | 100.0 /100 | #28 | Exceptional 20.8% |
| Immigrants | Senegal | 100.0 /100 | #29 | Exceptional 20.9% |