Soviet Union vs Immigrants from the Azores Wage/Income Gap
COMPARE
Soviet Union
Immigrants from the Azores
Wage/Income Gap
Wage/Income Gap Comparison
Soviet Union
Immigrants from the Azores
24.2%
WAGE/INCOME GAP
97.6/ 100
METRIC RATING
111th/ 347
METRIC RANK
27.2%
WAGE/INCOME GAP
3.5/ 100
METRIC RATING
245th/ 347
METRIC RANK
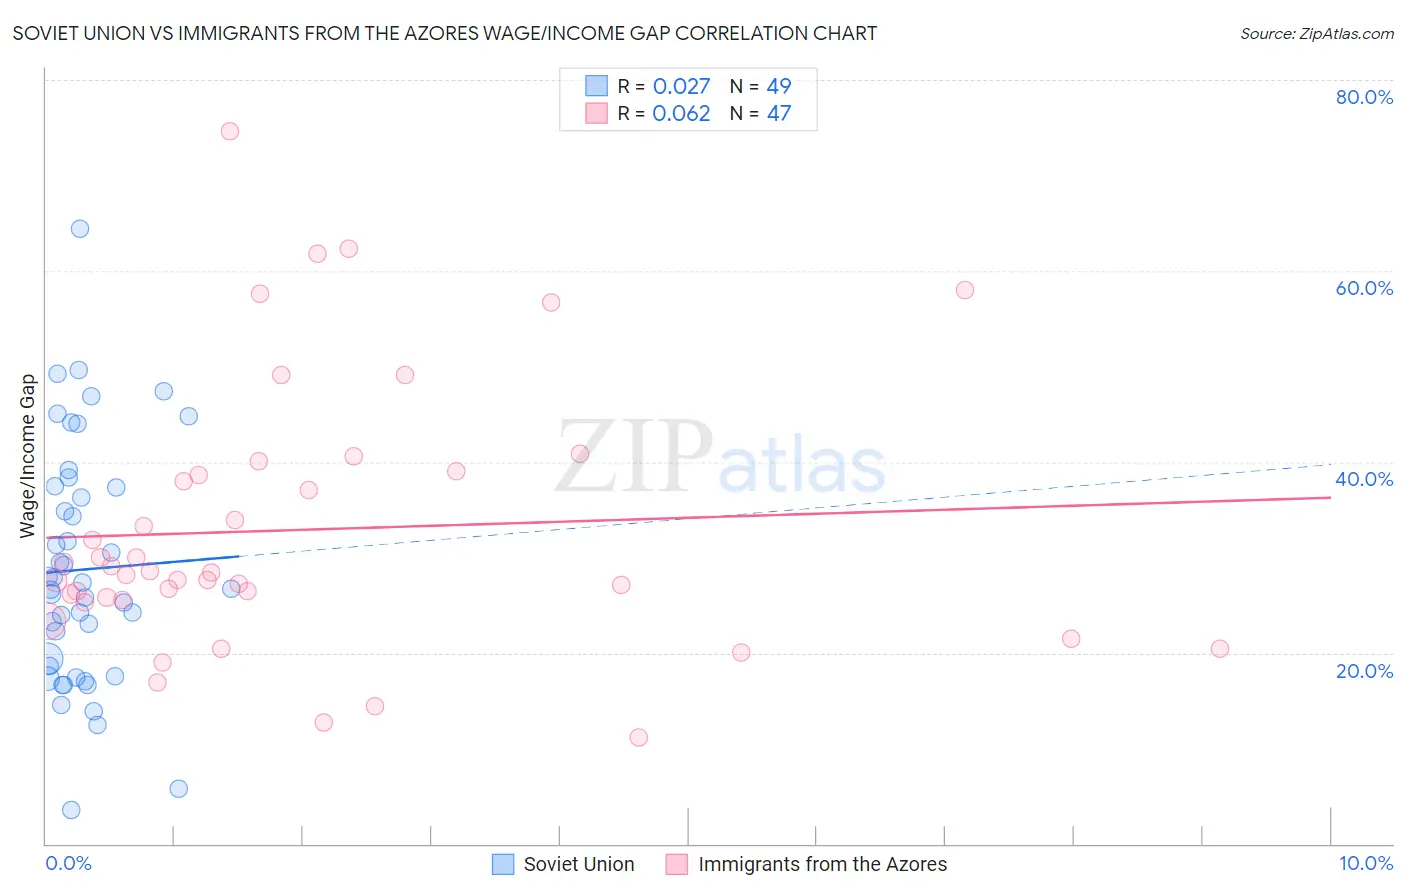
Soviet Union vs Immigrants from the Azores Wage/Income Gap Correlation Chart
The statistical analysis conducted on geographies consisting of 43,506,320 people shows no correlation between the proportion of Soviet Union and wage/income gap percentage in the United States with a correlation coefficient (R) of 0.027 and weighted average of 24.2%. Similarly, the statistical analysis conducted on geographies consisting of 46,247,590 people shows a slight positive correlation between the proportion of Immigrants from the Azores and wage/income gap percentage in the United States with a correlation coefficient (R) of 0.062 and weighted average of 27.2%, a difference of 12.2%.
Wage/Income Gap Correlation Summary
| Measurement | Soviet Union | Immigrants from the Azores |
| Minimum | 3.5% | 11.1% |
| Maximum | 64.4% | 74.6% |
| Range | 60.9% | 63.5% |
| Mean | 28.7% | 32.9% |
| Median | 26.8% | 28.4% |
| Interquartile 25% (IQ1) | 18.1% | 25.6% |
| Interquartile 75% (IQ3) | 37.4% | 39.0% |
| Interquartile Range (IQR) | 19.3% | 13.4% |
| Standard Deviation (Sample) | 12.5% | 14.0% |
| Standard Deviation (Population) | 12.4% | 13.8% |
Similar Demographics by Wage/Income Gap
Demographics Similar to Soviet Union by Wage/Income Gap
In terms of wage/income gap, the demographic groups most similar to Soviet Union are Immigrants from Colombia (24.3%, a difference of 0.40%), Immigrants from Morocco (24.1%, a difference of 0.44%), Sioux (24.3%, a difference of 0.45%), Panamanian (24.4%, a difference of 0.65%), and Ugandan (24.1%, a difference of 0.66%).
| Demographics | Rating | Rank | Wage/Income Gap |
| Tlingit-Haida | 98.7 /100 | #104 | Exceptional 24.0% |
| Moroccans | 98.6 /100 | #105 | Exceptional 24.0% |
| Sudanese | 98.6 /100 | #106 | Exceptional 24.0% |
| Yaqui | 98.4 /100 | #107 | Exceptional 24.0% |
| Immigrants | Albania | 98.4 /100 | #108 | Exceptional 24.0% |
| Ugandans | 98.3 /100 | #109 | Exceptional 24.1% |
| Immigrants | Morocco | 98.1 /100 | #110 | Exceptional 24.1% |
| Soviet Union | 97.6 /100 | #111 | Exceptional 24.2% |
| Immigrants | Colombia | 97.0 /100 | #112 | Exceptional 24.3% |
| Sioux | 96.9 /100 | #113 | Exceptional 24.3% |
| Panamanians | 96.5 /100 | #114 | Exceptional 24.4% |
| Immigrants | Kenya | 96.4 /100 | #115 | Exceptional 24.4% |
| Alaska Natives | 96.0 /100 | #116 | Exceptional 24.4% |
| Immigrants | Afghanistan | 95.9 /100 | #117 | Exceptional 24.4% |
| Immigrants | Micronesia | 95.8 /100 | #118 | Exceptional 24.4% |
Demographics Similar to Immigrants from the Azores by Wage/Income Gap
In terms of wage/income gap, the demographic groups most similar to Immigrants from the Azores are Chickasaw (27.2%, a difference of 0.020%), Nonimmigrants (27.2%, a difference of 0.080%), Immigrants from Sri Lanka (27.1%, a difference of 0.090%), Spanish (27.1%, a difference of 0.090%), and Creek (27.1%, a difference of 0.14%).
| Demographics | Rating | Rank | Wage/Income Gap |
| Osage | 4.4 /100 | #238 | Tragic 27.1% |
| Estonians | 4.3 /100 | #239 | Tragic 27.1% |
| Immigrants | Europe | 3.8 /100 | #240 | Tragic 27.1% |
| Creek | 3.8 /100 | #241 | Tragic 27.1% |
| Immigrants | Sri Lanka | 3.7 /100 | #242 | Tragic 27.1% |
| Spanish | 3.6 /100 | #243 | Tragic 27.1% |
| Chickasaw | 3.5 /100 | #244 | Tragic 27.2% |
| Immigrants | Azores | 3.5 /100 | #245 | Tragic 27.2% |
| Immigrants | Nonimmigrants | 3.3 /100 | #246 | Tragic 27.2% |
| Celtics | 2.8 /100 | #247 | Tragic 27.3% |
| Cypriots | 2.8 /100 | #248 | Tragic 27.3% |
| Carpatho Rusyns | 2.7 /100 | #249 | Tragic 27.3% |
| Immigrants | Czechoslovakia | 2.7 /100 | #250 | Tragic 27.3% |
| Immigrants | Norway | 2.5 /100 | #251 | Tragic 27.3% |
| Ukrainians | 2.4 /100 | #252 | Tragic 27.3% |