South African vs Nigerian Per Capita Income
COMPARE
South African
Nigerian
Per Capita Income
Per Capita Income Comparison
South Africans
Nigerians
$50,044
PER CAPITA INCOME
99.9/ 100
METRIC RATING
57th/ 347
METRIC RANK
$41,026
PER CAPITA INCOME
4.9/ 100
METRIC RATING
229th/ 347
METRIC RANK
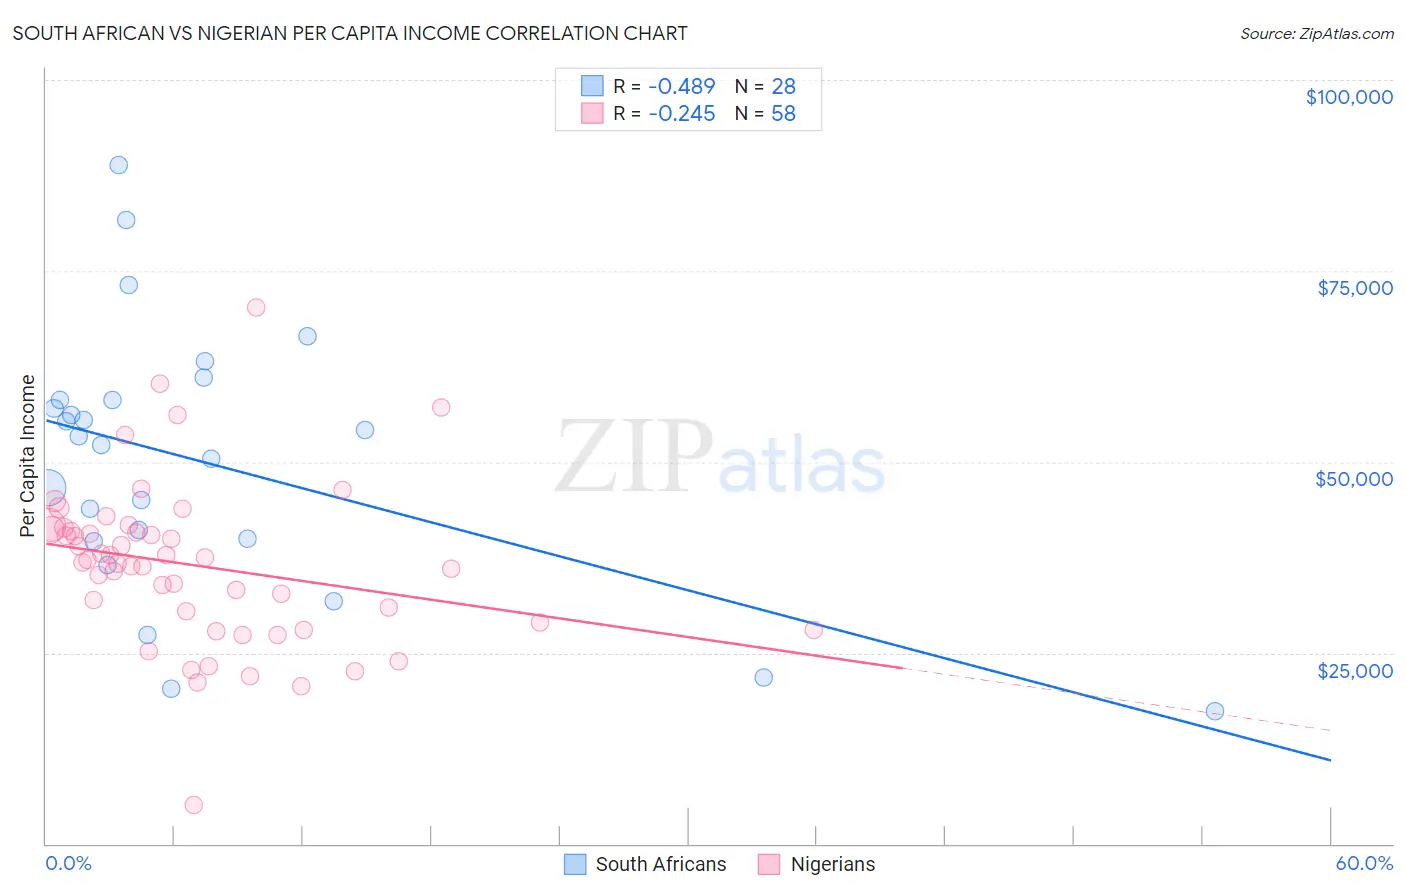
South African vs Nigerian Per Capita Income Correlation Chart
The statistical analysis conducted on geographies consisting of 182,604,546 people shows a moderate negative correlation between the proportion of South Africans and per capita income in the United States with a correlation coefficient (R) of -0.489 and weighted average of $50,044. Similarly, the statistical analysis conducted on geographies consisting of 332,796,588 people shows a weak negative correlation between the proportion of Nigerians and per capita income in the United States with a correlation coefficient (R) of -0.245 and weighted average of $41,026, a difference of 22.0%.
Per Capita Income Correlation Summary
| Measurement | South African | Nigerian |
| Minimum | $17,364 | $5,085 |
| Maximum | $88,818 | $70,186 |
| Range | $71,454 | $65,101 |
| Mean | $49,855 | $36,468 |
| Median | $52,728 | $37,024 |
| Interquartile 25% (IQ1) | $39,824 | $28,928 |
| Interquartile 75% (IQ3) | $58,137 | $41,176 |
| Interquartile Range (IQR) | $18,313 | $12,248 |
| Standard Deviation (Sample) | $17,281 | $10,721 |
| Standard Deviation (Population) | $16,970 | $10,628 |
Similar Demographics by Per Capita Income
Demographics Similar to South Africans by Per Capita Income
In terms of per capita income, the demographic groups most similar to South Africans are Asian ($50,057, a difference of 0.030%), Immigrants from Western Europe ($50,065, a difference of 0.040%), Immigrants from Malaysia ($49,983, a difference of 0.12%), Bhutanese ($49,894, a difference of 0.30%), and Immigrants from Scotland ($49,893, a difference of 0.30%).
| Demographics | Rating | Rank | Per Capita Income |
| Immigrants | Sri Lanka | 100.0 /100 | #50 | Exceptional $50,555 |
| Immigrants | Netherlands | 100.0 /100 | #51 | Exceptional $50,458 |
| Immigrants | Croatia | 99.9 /100 | #52 | Exceptional $50,417 |
| Paraguayans | 99.9 /100 | #53 | Exceptional $50,385 |
| Immigrants | Belarus | 99.9 /100 | #54 | Exceptional $50,303 |
| Immigrants | Western Europe | 99.9 /100 | #55 | Exceptional $50,065 |
| Asians | 99.9 /100 | #56 | Exceptional $50,057 |
| South Africans | 99.9 /100 | #57 | Exceptional $50,044 |
| Immigrants | Malaysia | 99.9 /100 | #58 | Exceptional $49,983 |
| Bhutanese | 99.9 /100 | #59 | Exceptional $49,894 |
| Immigrants | Scotland | 99.9 /100 | #60 | Exceptional $49,893 |
| Argentineans | 99.9 /100 | #61 | Exceptional $49,862 |
| Immigrants | Asia | 99.9 /100 | #62 | Exceptional $49,741 |
| Maltese | 99.9 /100 | #63 | Exceptional $49,640 |
| Immigrants | Argentina | 99.9 /100 | #64 | Exceptional $49,627 |
Demographics Similar to Nigerians by Per Capita Income
In terms of per capita income, the demographic groups most similar to Nigerians are Native Hawaiian ($41,017, a difference of 0.020%), Senegalese ($41,000, a difference of 0.060%), Guyanese ($40,949, a difference of 0.19%), Immigrants from Grenada ($41,123, a difference of 0.24%), and Immigrants from Ghana ($41,131, a difference of 0.26%).
| Demographics | Rating | Rank | Per Capita Income |
| Immigrants | Iraq | 7.1 /100 | #222 | Tragic $41,365 |
| Immigrants | Cameroon | 6.8 /100 | #223 | Tragic $41,334 |
| Immigrants | St. Vincent and the Grenadines | 6.4 /100 | #224 | Tragic $41,270 |
| West Indians | 6.0 /100 | #225 | Tragic $41,217 |
| Immigrants | Ecuador | 5.9 /100 | #226 | Tragic $41,195 |
| Immigrants | Ghana | 5.5 /100 | #227 | Tragic $41,131 |
| Immigrants | Grenada | 5.5 /100 | #228 | Tragic $41,123 |
| Nigerians | 4.9 /100 | #229 | Tragic $41,026 |
| Native Hawaiians | 4.9 /100 | #230 | Tragic $41,017 |
| Senegalese | 4.8 /100 | #231 | Tragic $41,000 |
| Guyanese | 4.5 /100 | #232 | Tragic $40,949 |
| Delaware | 3.8 /100 | #233 | Tragic $40,778 |
| Immigrants | West Indies | 3.7 /100 | #234 | Tragic $40,763 |
| Immigrants | Guyana | 3.6 /100 | #235 | Tragic $40,742 |
| Immigrants | Nonimmigrants | 3.4 /100 | #236 | Tragic $40,669 |