Immigrants from Grenada vs Pennsylvania German Median Female Earnings

COMPARE

Immigrants from Grenada
Race
Ancestry
AfghanAfricanAlaska NativeAlaskan AthabascanAlbanianAleutAlsatianAmericanApacheArabArapahoArgentineanArmenianAssyrian/Chaldean/SyriacAustralianAustrianBahamianBangladeshiBarbadianBasqueBelgianBelizeanBermudanBhutaneseBlackfeetBolivianBrazilianBritishBritish West IndianBulgarianBurmeseCajunCambodianCanadianCape VerdeanCarpatho RusynCelticCentral AmericanCentral American IndianCherokeeCheyenneChickasawChileanChineseChippewaChoctawColombianColvilleComancheCosta RicanCreeCreekCroatianCrowCubanCypriotCzechCzechoslovakianDanishDelawareDominicanDutchDutch West IndianEastern EuropeanEcuadorianEgyptianEnglishEstonianEthiopianEuropeanFijianFilipinoFinnishFrenchFrench American IndianFrench CanadianGermanGerman RussianGhanaianGreekGuamanian/ChamorroGuatemalanGuyaneseHaitianHmongHonduranHopiHoumaHungarianIcelanderIndian (Asian)IndonesianInupiatIranianIraqiIrishIroquoisIsraeliItalianJamaicanJapaneseJordanianKenyanKiowaKoreanLaotianLatvianLebaneseLiberianLithuanianLumbeeLuxembourgerMacedonianMalaysianMalteseMarshalleseMenomineeMexicanMexican American IndianMongolianMoroccanNative HawaiianNavajoNepaleseNew ZealanderNicaraguanNigerianNorthern EuropeanNorwegianOkinawanOsageOttawaPaiutePakistaniPalestinianPanamanianParaguayanPeruvianPimaPolishPortuguesePotawatomiPuebloPuerto RicanPuget Sound SalishRomanianRussianSalvadoranSamoanScandinavianScotch-IrishScottishSeminoleSenegaleseSerbianShoshoneSierra LeoneanSiouxSlavicSlovakSloveneSomaliSouth AfricanSouth AmericanSouth American IndianSoviet UnionSpaniardSpanishSpanish AmericanSpanish American IndianSri LankanSubsaharan AfricanSudaneseSwedishSwissSyrianTaiwaneseThaiTlingit-HaidaTohono O'OdhamTonganTrinidadian and TobagonianTsimshianTurkishU.S. Virgin IslanderUgandanUkrainianUruguayanUteVenezuelanVietnameseWelshWest IndianYakamaYaquiYugoslavianYumanYup'ikZimbabwean
Immigration
NonimmigrantsImmigrantsAfghanistanAfricaAlbaniaArgentinaArmeniaAsiaAustraliaAustriaBahamasBangladeshBarbadosBelarusBelgiumBelizeBoliviaBosnia and HerzegovinaBrazilBulgariaBurma/MyanmarCabo VerdeCambodiaCameroonCanadaCaribbeanCentral AmericaChileChinaColombiaCongoCosta RicaCroatiaCubaCzechoslovakiaDenmarkDominicaDominican RepublicEastern AfricaEastern AsiaEastern EuropeEcuadorEgyptEl SalvadorEnglandEritreaEthiopiaEuropeFijiFranceGermanyGhanaGreeceGrenadaGuatemalaGuyanaHaitiHondurasHong KongHungaryIndiaIndonesiaIranIraqIrelandIsraelItalyJamaicaJapanJordanKazakhstanKenyaKoreaKuwaitLaosLatin AmericaLatviaLebanonLiberiaLithuaniaMalaysiaMexicoMicronesiaMiddle AfricaMoldovaMoroccoNepalNetherlandsNicaraguaNigeriaNorth AmericaNorth MacedoniaNorthern AfricaNorthern EuropeNorwayOceaniaPakistanPanamaPeruPhilippinesPolandPortugalRomaniaRussiaSaudi ArabiaScotlandSenegalSerbiaSierra LeoneSingaporeSomaliaSouth AfricaSouth AmericaSouth Central AsiaSouth Eastern AsiaSouthern EuropeSpainSri LankaSt. Vincent and the GrenadinesSudanSwedenSwitzerlandSyriaTaiwanThailandTrinidad and TobagoTurkeyUgandaUkraineUruguayUzbekistanVenezuelaVietnamWest IndiesWestern AfricaWestern AsiaWestern EuropeYemenZaireZimbabweAzores
Pennsylvania German
Race
Ancestry
AfghanAfricanAlaska NativeAlaskan AthabascanAlbanianAleutAlsatianAmericanApacheArabArapahoArgentineanArmenianAssyrian/Chaldean/SyriacAustralianAustrianBahamianBangladeshiBarbadianBasqueBelgianBelizeanBermudanBhutaneseBlackfeetBolivianBrazilianBritishBritish West IndianBulgarianBurmeseCajunCambodianCanadianCape VerdeanCarpatho RusynCelticCentral AmericanCentral American IndianCherokeeCheyenneChickasawChileanChineseChippewaChoctawColombianColvilleComancheCosta RicanCreeCreekCroatianCrowCubanCypriotCzechCzechoslovakianDanishDelawareDominicanDutchDutch West IndianEastern EuropeanEcuadorianEgyptianEnglishEstonianEthiopianEuropeanFijianFilipinoFinnishFrenchFrench American IndianFrench CanadianGermanGerman RussianGhanaianGreekGuamanian/ChamorroGuatemalanGuyaneseHaitianHmongHonduranHopiHoumaHungarianIcelanderIndian (Asian)IndonesianInupiatIranianIraqiIrishIroquoisIsraeliItalianJamaicanJapaneseJordanianKenyanKiowaKoreanLaotianLatvianLebaneseLiberianLithuanianLumbeeLuxembourgerMacedonianMalaysianMalteseMarshalleseMenomineeMexicanMexican American IndianMongolianMoroccanNative HawaiianNavajoNepaleseNew ZealanderNicaraguanNigerianNorthern EuropeanNorwegianOkinawanOsageOttawaPaiutePakistaniPalestinianPanamanianParaguayanPennsylvania GermanPeruvianPimaPolishPortuguesePotawatomiPuebloPuerto RicanPuget Sound SalishRomanianRussianSalvadoranSamoanScandinavianScotch-IrishScottishSeminoleSenegaleseSerbianShoshoneSierra LeoneanSiouxSlavicSlovakSloveneSomaliSouth AfricanSouth AmericanSouth American IndianSoviet UnionSpaniardSpanishSpanish AmericanSpanish American IndianSri LankanSubsaharan AfricanSudaneseSwedishSwissSyrianTaiwaneseThaiTlingit-HaidaTohono O'OdhamTonganTrinidadian and TobagonianTsimshianTurkishU.S. Virgin IslanderUgandanUkrainianUruguayanUteVenezuelanVietnameseWelshWest IndianYakamaYaquiYugoslavianYumanYup'ikZimbabwean
Immigration
NonimmigrantsImmigrantsAfghanistanAfricaAlbaniaArgentinaArmeniaAsiaAustraliaAustriaBahamasBangladeshBarbadosBelarusBelgiumBelizeBoliviaBosnia and HerzegovinaBrazilBulgariaBurma/MyanmarCabo VerdeCambodiaCameroonCanadaCaribbeanCentral AmericaChileChinaColombiaCongoCosta RicaCroatiaCubaCzechoslovakiaDenmarkDominicaDominican RepublicEastern AfricaEastern AsiaEastern EuropeEcuadorEgyptEl SalvadorEnglandEritreaEthiopiaEuropeFijiFranceGermanyGhanaGreeceGuatemalaGuyanaHaitiHondurasHong KongHungaryIndiaIndonesiaIranIraqIrelandIsraelItalyJamaicaJapanJordanKazakhstanKenyaKoreaKuwaitLaosLatin AmericaLatviaLebanonLiberiaLithuaniaMalaysiaMexicoMicronesiaMiddle AfricaMoldovaMoroccoNepalNetherlandsNicaraguaNigeriaNorth AmericaNorth MacedoniaNorthern AfricaNorthern EuropeNorwayOceaniaPakistanPanamaPeruPhilippinesPolandPortugalRomaniaRussiaSaudi ArabiaScotlandSenegalSerbiaSierra LeoneSingaporeSomaliaSouth AfricaSouth AmericaSouth Central AsiaSouth Eastern AsiaSouthern EuropeSpainSri LankaSt. Vincent and the GrenadinesSudanSwedenSwitzerlandSyriaTaiwanThailandTrinidad and TobagoTurkeyUgandaUkraineUruguayUzbekistanVenezuelaVietnamWest IndiesWestern AfricaWestern AsiaWestern EuropeYemenZaireZimbabweAzores
Median Female Earnings
Income
Poverty
Unemployment
Labor Participation
Family Structure
Vehicle Availability
Education Level
Disability

Median Female Earnings Comparison

Immigrants from Grenada

Pennsylvania Germans

Exceptional
Tragic
$41,932
MEDIAN FEMALE EARNINGS
99.0/ 100
METRIC RATING
93rd/ 347
METRIC RANK
$34,802
MEDIAN FEMALE EARNINGS
0.0/ 100
METRIC RATING
315th/ 347
METRIC RANK

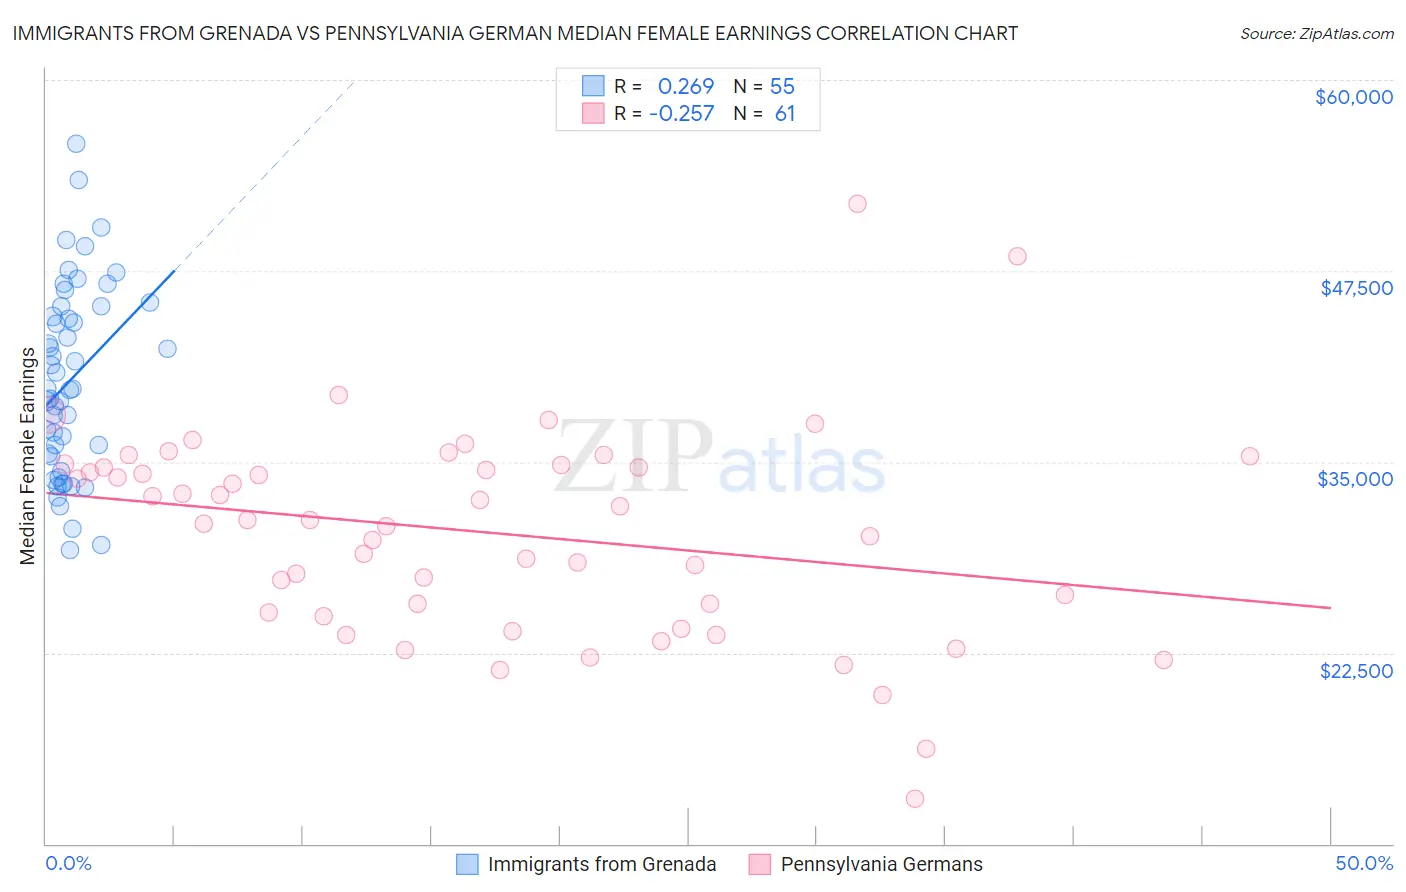
Immigrants from Grenada vs Pennsylvania German Median Female Earnings Correlation Chart

The statistical analysis conducted on geographies consisting of 67,190,904 people shows a weak positive correlation between the proportion of Immigrants from Grenada and median female earnings in the United States with a correlation coefficient (R) of 0.269 and weighted average of $41,932. Similarly, the statistical analysis conducted on geographies consisting of 233,955,345 people shows a weak negative correlation between the proportion of Pennsylvania Germans and median female earnings in the United States with a correlation coefficient (R) of -0.257 and weighted average of $34,802, a difference of 20.5%.
Immigrants from Grenada vs Pennsylvania German Median Female Earnings

Median Female Earnings Correlation Summary

MeasurementImmigrants from GrenadaPennsylvania German
Minimum$29,237$12,961
Maximum$55,809$51,875
Range$26,572$38,914
Mean$40,324$30,372
Median$39,773$31,194
Interquartile 25% (IQ1)$35,346$25,044
Interquartile 75% (IQ3)$45,180$34,733
Interquartile Range (IQR)$9,834$9,690
Standard Deviation (Sample)$6,162$6,887
Standard Deviation (Population)$6,105$6,830

Similar Demographics by Median Female Earnings

Demographics Similar to Immigrants from Grenada by Median Female Earnings

In terms of median female earnings, the demographic groups most similar to Immigrants from Grenada are Argentinean ($41,952, a difference of 0.050%), Immigrants from Western Europe ($41,990, a difference of 0.14%), Moroccan ($41,872, a difference of 0.14%), Immigrants from Netherlands ($41,870, a difference of 0.15%), and Ukrainian ($42,015, a difference of 0.20%).
DemographicsRating | RankMedian Female Earnings
Immigrants | St. Vincent and the Grenadines
99.3
/100
|
#86
Exceptional
$42,108
Lithuanians
99.3
/100
|
#87
Exceptional
$42,108
Immigrants | Northern Africa
99.3
/100
|
#88
Exceptional
$42,084
Immigrants | Afghanistan
99.3
/100
|
#89
Exceptional
$42,055
Ukrainians
99.2
/100
|
#90
Exceptional
$42,015
Immigrants | Western Europe
99.2
/100
|
#91
Exceptional
$41,990
Argentineans
99.1
/100
|
#92
Exceptional
$41,952
Immigrants | Grenada
99.0
/100
|
#93
Exceptional
$41,932
Moroccans
98.9
/100
|
#94
Exceptional
$41,872
Immigrants | Netherlands
98.9
/100
|
#95
Exceptional
$41,870
South Africans
98.8
/100
|
#96
Exceptional
$41,825
Immigrants | Hungary
98.8
/100
|
#97
Exceptional
$41,820
Immigrants | Scotland
98.7
/100
|
#98
Exceptional
$41,771
Immigrants | Barbados
98.4
/100
|
#99
Exceptional
$41,685
Romanians
98.3
/100
|
#100
Exceptional
$41,663

Demographics Similar to Pennsylvania Germans by Median Female Earnings

In terms of median female earnings, the demographic groups most similar to Pennsylvania Germans are Cherokee ($34,742, a difference of 0.17%), Potawatomi ($34,739, a difference of 0.18%), Apache ($34,895, a difference of 0.27%), Immigrants from Yemen ($34,693, a difference of 0.31%), and Shoshone ($34,677, a difference of 0.36%).
DemographicsRating | RankMedian Female Earnings
Immigrants | Bahamas
0.0
/100
|
#308
Tragic
$35,027
Hondurans
0.0
/100
|
#309
Tragic
$35,013
Chippewa
0.0
/100
|
#310
Tragic
$35,003
Ute
0.0
/100
|
#311
Tragic
$34,960
Yaqui
0.0
/100
|
#312
Tragic
$34,943
Cubans
0.0
/100
|
#313
Tragic
$34,942
Apache
0.0
/100
|
#314
Tragic
$34,895
Pennsylvania Germans
0.0
/100
|
#315
Tragic
$34,802
Cherokee
0.0
/100
|
#316
Tragic
$34,742
Potawatomi
0.0
/100
|
#317
Tragic
$34,739
Immigrants | Yemen
0.0
/100
|
#318
Tragic
$34,693
Shoshone
0.0
/100
|
#319
Tragic
$34,677
Immigrants | Honduras
0.0
/100
|
#320
Tragic
$34,647
Hispanics or Latinos
0.0
/100
|
#321
Tragic
$34,421
Chickasaw
0.0
/100
|
#322
Tragic
$34,414