Slavic vs Pennsylvania German Householder Income Under 25 years
COMPARE
Slavic
Pennsylvania German
Householder Income Under 25 years
Householder Income Under 25 years Comparison
Slavs
Pennsylvania Germans
$50,563
HOUSEHOLDER INCOME UNDER 25 YEARS
1.8/ 100
METRIC RATING
248th/ 347
METRIC RANK
$50,852
HOUSEHOLDER INCOME UNDER 25 YEARS
3.7/ 100
METRIC RATING
233rd/ 347
METRIC RANK
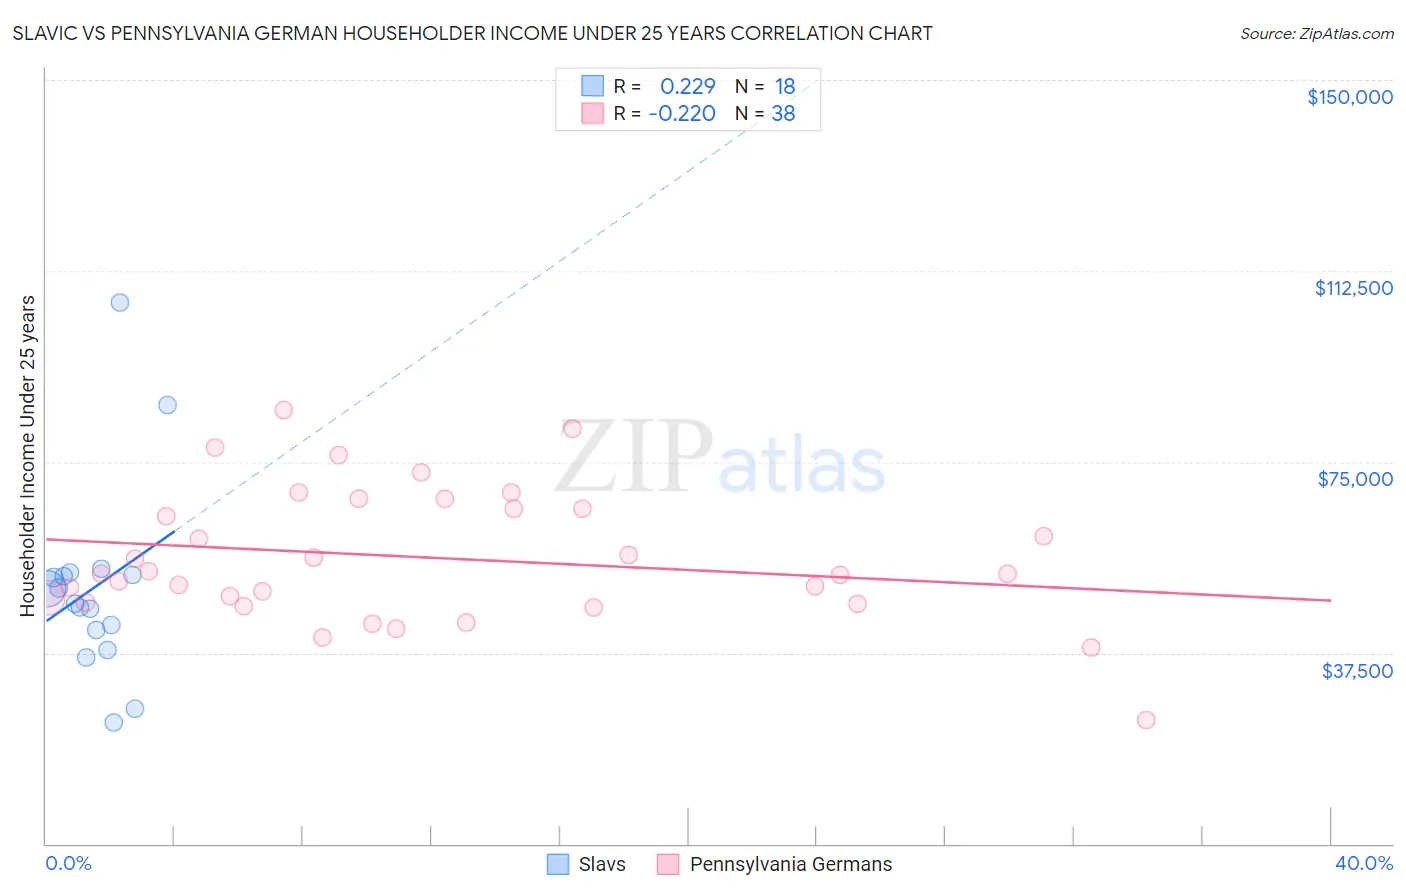
Slavic vs Pennsylvania German Householder Income Under 25 years Correlation Chart
The statistical analysis conducted on geographies consisting of 235,100,045 people shows a weak positive correlation between the proportion of Slavs and household income with householder under the age of 25 in the United States with a correlation coefficient (R) of 0.229 and weighted average of $50,563. Similarly, the statistical analysis conducted on geographies consisting of 205,538,034 people shows a weak negative correlation between the proportion of Pennsylvania Germans and household income with householder under the age of 25 in the United States with a correlation coefficient (R) of -0.220 and weighted average of $50,852, a difference of 0.57%.
Householder Income Under 25 years Correlation Summary
| Measurement | Slavic | Pennsylvania German |
| Minimum | $23,750 | $24,348 |
| Maximum | $106,250 | $85,269 |
| Range | $82,500 | $60,921 |
| Mean | $50,421 | $56,167 |
| Median | $48,652 | $53,030 |
| Interquartile 25% (IQ1) | $41,986 | $47,312 |
| Interquartile 75% (IQ3) | $52,857 | $65,833 |
| Interquartile Range (IQR) | $10,871 | $18,521 |
| Standard Deviation (Sample) | $19,147 | $13,051 |
| Standard Deviation (Population) | $18,607 | $12,878 |
Demographics Similar to Slavs and Pennsylvania Germans by Householder Income Under 25 years
In terms of householder income under 25 years, the demographic groups most similar to Slavs are Immigrants from Bosnia and Herzegovina ($50,565, a difference of 0.0%), Scottish ($50,554, a difference of 0.020%), Welsh ($50,597, a difference of 0.070%), Immigrants from Africa ($50,609, a difference of 0.090%), and Immigrants from Cabo Verde ($50,520, a difference of 0.090%). Similarly, the demographic groups most similar to Pennsylvania Germans are Slovene ($50,886, a difference of 0.070%), Kenyan ($50,815, a difference of 0.070%), Spanish ($50,813, a difference of 0.080%), English ($50,805, a difference of 0.090%), and German ($50,804, a difference of 0.090%).
| Demographics | Rating | Rank | Householder Income Under 25 years |
| Jamaicans | 4.4 /100 | #230 | Tragic $50,929 |
| Ugandans | 4.3 /100 | #231 | Tragic $50,923 |
| Slovenes | 4.0 /100 | #232 | Tragic $50,886 |
| Pennsylvania Germans | 3.7 /100 | #233 | Tragic $50,852 |
| Kenyans | 3.3 /100 | #234 | Tragic $50,815 |
| Spanish | 3.3 /100 | #235 | Tragic $50,813 |
| English | 3.3 /100 | #236 | Tragic $50,805 |
| Germans | 3.3 /100 | #237 | Tragic $50,804 |
| Iraqis | 3.2 /100 | #238 | Tragic $50,802 |
| Immigrants | Caribbean | 2.9 /100 | #239 | Tragic $50,757 |
| Immigrants | Lebanon | 2.7 /100 | #240 | Tragic $50,729 |
| Immigrants | Micronesia | 2.5 /100 | #241 | Tragic $50,691 |
| Cubans | 2.3 /100 | #242 | Tragic $50,655 |
| Immigrants | Thailand | 2.2 /100 | #243 | Tragic $50,645 |
| Marshallese | 2.1 /100 | #244 | Tragic $50,627 |
| Immigrants | Africa | 2.0 /100 | #245 | Tragic $50,609 |
| Welsh | 2.0 /100 | #246 | Tragic $50,597 |
| Immigrants | Bosnia and Herzegovina | 1.8 /100 | #247 | Tragic $50,565 |
| Slavs | 1.8 /100 | #248 | Tragic $50,563 |
| Scottish | 1.8 /100 | #249 | Tragic $50,554 |
| Immigrants | Cabo Verde | 1.7 /100 | #250 | Tragic $50,520 |