Slavic vs Pennsylvania German Disability Age Under 5
COMPARE
Slavic
Pennsylvania German
Disability Age Under 5
Disability Age Under 5 Comparison
Slavs
Pennsylvania Germans
1.4%
DISABILITY AGE UNDER 5
0.3/ 100
METRIC RATING
260th/ 347
METRIC RANK
1.9%
DISABILITY AGE UNDER 5
0.0/ 100
METRIC RATING
335th/ 347
METRIC RANK
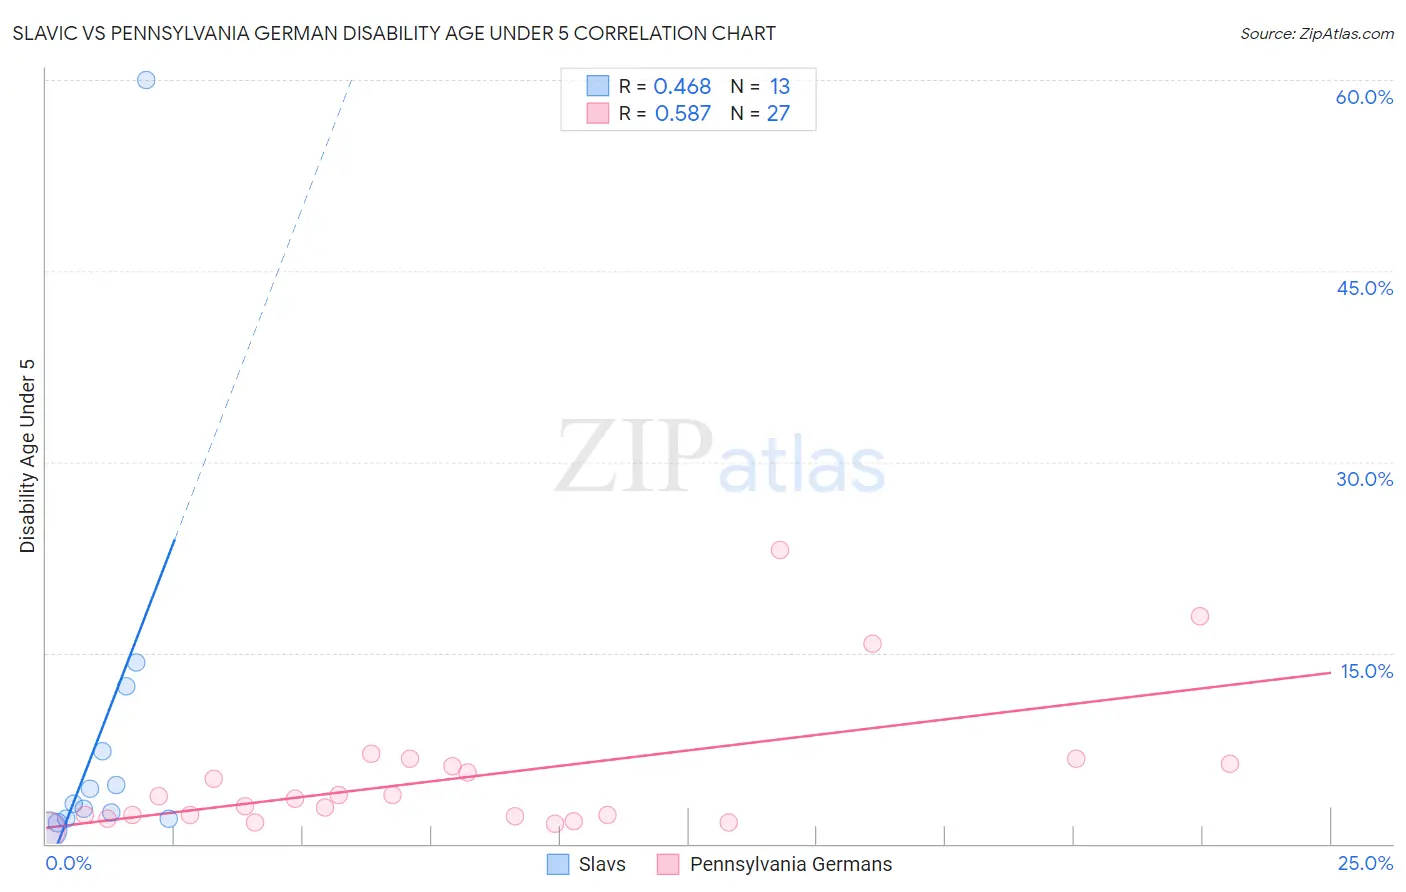
Slavic vs Pennsylvania German Disability Age Under 5 Correlation Chart
The statistical analysis conducted on geographies consisting of 161,605,234 people shows a moderate positive correlation between the proportion of Slavs and percentage of population with a disability under the age of 5 in the United States with a correlation coefficient (R) of 0.468 and weighted average of 1.4%. Similarly, the statistical analysis conducted on geographies consisting of 141,367,234 people shows a substantial positive correlation between the proportion of Pennsylvania Germans and percentage of population with a disability under the age of 5 in the United States with a correlation coefficient (R) of 0.587 and weighted average of 1.9%, a difference of 38.5%.
Disability Age Under 5 Correlation Summary
| Measurement | Slavic | Pennsylvania German |
| Minimum | 1.0% | 1.1% |
| Maximum | 60.0% | 23.1% |
| Range | 59.0% | 22.0% |
| Mean | 9.1% | 5.3% |
| Median | 3.1% | 3.5% |
| Interquartile 25% (IQ1) | 2.0% | 2.1% |
| Interquartile 75% (IQ3) | 9.8% | 6.3% |
| Interquartile Range (IQR) | 7.8% | 4.2% |
| Standard Deviation (Sample) | 15.9% | 5.3% |
| Standard Deviation (Population) | 15.2% | 5.2% |
Similar Demographics by Disability Age Under 5
Demographics Similar to Slavs by Disability Age Under 5
In terms of disability age under 5, the demographic groups most similar to Slavs are Immigrants from Southern Europe (1.4%, a difference of 0.21%), Costa Rican (1.4%, a difference of 0.37%), Slovene (1.4%, a difference of 0.55%), Immigrants from Netherlands (1.4%, a difference of 0.67%), and Immigrants from Dominica (1.4%, a difference of 0.83%).
| Demographics | Rating | Rank | Disability Age Under 5 |
| Australians | 0.7 /100 | #253 | Tragic 1.4% |
| Immigrants | Brazil | 0.7 /100 | #254 | Tragic 1.4% |
| Immigrants | Liberia | 0.6 /100 | #255 | Tragic 1.4% |
| Immigrants | Western Europe | 0.5 /100 | #256 | Tragic 1.4% |
| Slovenes | 0.3 /100 | #257 | Tragic 1.4% |
| Costa Ricans | 0.3 /100 | #258 | Tragic 1.4% |
| Immigrants | Southern Europe | 0.3 /100 | #259 | Tragic 1.4% |
| Slavs | 0.3 /100 | #260 | Tragic 1.4% |
| Immigrants | Netherlands | 0.2 /100 | #261 | Tragic 1.4% |
| Immigrants | Dominica | 0.2 /100 | #262 | Tragic 1.4% |
| Spanish | 0.2 /100 | #263 | Tragic 1.4% |
| Yugoslavians | 0.1 /100 | #264 | Tragic 1.4% |
| Carpatho Rusyns | 0.1 /100 | #265 | Tragic 1.4% |
| Immigrants | Germany | 0.1 /100 | #266 | Tragic 1.4% |
| Cree | 0.1 /100 | #267 | Tragic 1.4% |
Demographics Similar to Pennsylvania Germans by Disability Age Under 5
In terms of disability age under 5, the demographic groups most similar to Pennsylvania Germans are Native/Alaskan (1.9%, a difference of 0.38%), Dutch West Indian (1.9%, a difference of 0.78%), Paraguayan (2.0%, a difference of 1.3%), Chippewa (1.9%, a difference of 3.7%), and French Canadian (1.9%, a difference of 3.8%).
| Demographics | Rating | Rank | Disability Age Under 5 |
| Americans | 0.0 /100 | #328 | Tragic 1.9% |
| Houma | 0.0 /100 | #329 | Tragic 1.9% |
| Choctaw | 0.0 /100 | #330 | Tragic 1.9% |
| French Canadians | 0.0 /100 | #331 | Tragic 1.9% |
| Chippewa | 0.0 /100 | #332 | Tragic 1.9% |
| Dutch West Indians | 0.0 /100 | #333 | Tragic 1.9% |
| Natives/Alaskans | 0.0 /100 | #334 | Tragic 1.9% |
| Pennsylvania Germans | 0.0 /100 | #335 | Tragic 1.9% |
| Paraguayans | 0.0 /100 | #336 | Tragic 2.0% |
| Apache | 0.0 /100 | #337 | Tragic 2.0% |
| Tohono O'odham | 0.0 /100 | #338 | Tragic 2.2% |
| Immigrants | Azores | 0.0 /100 | #339 | Tragic 2.2% |
| Menominee | 0.0 /100 | #340 | Tragic 2.3% |
| Tsimshian | 0.0 /100 | #341 | Tragic 2.4% |
| Alaska Natives | 0.0 /100 | #342 | Tragic 2.9% |