Immigrants from Canada vs Pennsylvania German Median Female Earnings
COMPARE
Immigrants from Canada
Pennsylvania German
Median Female Earnings
Median Female Earnings Comparison
Immigrants from Canada
Pennsylvania Germans
$41,373
MEDIAN FEMALE EARNINGS
97.0/ 100
METRIC RATING
111th/ 347
METRIC RANK
$34,802
MEDIAN FEMALE EARNINGS
0.0/ 100
METRIC RATING
315th/ 347
METRIC RANK
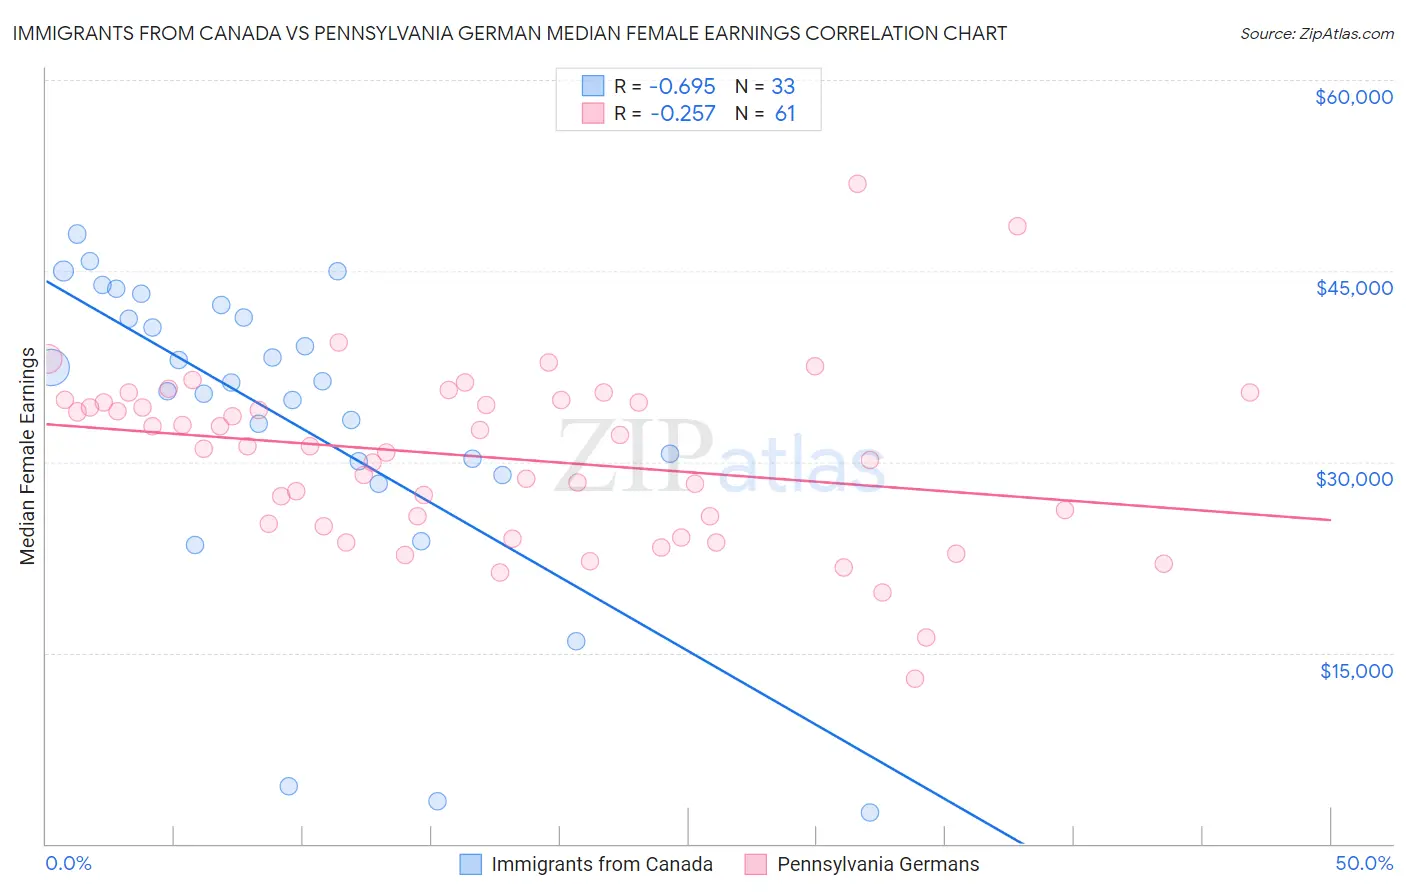
Immigrants from Canada vs Pennsylvania German Median Female Earnings Correlation Chart
The statistical analysis conducted on geographies consisting of 459,023,648 people shows a significant negative correlation between the proportion of Immigrants from Canada and median female earnings in the United States with a correlation coefficient (R) of -0.695 and weighted average of $41,373. Similarly, the statistical analysis conducted on geographies consisting of 233,955,345 people shows a weak negative correlation between the proportion of Pennsylvania Germans and median female earnings in the United States with a correlation coefficient (R) of -0.257 and weighted average of $34,802, a difference of 18.9%.
Median Female Earnings Correlation Summary
| Measurement | Immigrants from Canada | Pennsylvania German |
| Minimum | $2,499 | $12,961 |
| Maximum | $47,885 | $51,875 |
| Range | $45,386 | $38,914 |
| Mean | $33,293 | $30,372 |
| Median | $36,283 | $31,194 |
| Interquartile 25% (IQ1) | $29,495 | $25,044 |
| Interquartile 75% (IQ3) | $41,844 | $34,733 |
| Interquartile Range (IQR) | $12,349 | $9,690 |
| Standard Deviation (Sample) | $11,971 | $6,887 |
| Standard Deviation (Population) | $11,788 | $6,830 |
Similar Demographics by Median Female Earnings
Demographics Similar to Immigrants from Canada by Median Female Earnings
In terms of median female earnings, the demographic groups most similar to Immigrants from Canada are Immigrants from Western Asia ($41,375, a difference of 0.010%), Immigrants from North America ($41,319, a difference of 0.13%), Chinese ($41,461, a difference of 0.21%), Macedonian ($41,286, a difference of 0.21%), and Jordanian ($41,464, a difference of 0.22%).
| Demographics | Rating | Rank | Median Female Earnings |
| Immigrants | Zimbabwe | 97.8 /100 | #104 | Exceptional $41,527 |
| Italians | 97.7 /100 | #105 | Exceptional $41,505 |
| Immigrants | Eritrea | 97.6 /100 | #106 | Exceptional $41,485 |
| Palestinians | 97.6 /100 | #107 | Exceptional $41,484 |
| Jordanians | 97.5 /100 | #108 | Exceptional $41,464 |
| Chinese | 97.5 /100 | #109 | Exceptional $41,461 |
| Immigrants | Western Asia | 97.0 /100 | #110 | Exceptional $41,375 |
| Immigrants | Canada | 97.0 /100 | #111 | Exceptional $41,373 |
| Immigrants | North America | 96.7 /100 | #112 | Exceptional $41,319 |
| Macedonians | 96.4 /100 | #113 | Exceptional $41,286 |
| Immigrants | England | 96.4 /100 | #114 | Exceptional $41,277 |
| Koreans | 96.4 /100 | #115 | Exceptional $41,276 |
| Immigrants | Brazil | 96.4 /100 | #116 | Exceptional $41,273 |
| Barbadians | 96.3 /100 | #117 | Exceptional $41,261 |
| Immigrants | Lebanon | 95.6 /100 | #118 | Exceptional $41,183 |
Demographics Similar to Pennsylvania Germans by Median Female Earnings
In terms of median female earnings, the demographic groups most similar to Pennsylvania Germans are Cherokee ($34,742, a difference of 0.17%), Potawatomi ($34,739, a difference of 0.18%), Apache ($34,895, a difference of 0.27%), Immigrants from Yemen ($34,693, a difference of 0.31%), and Shoshone ($34,677, a difference of 0.36%).
| Demographics | Rating | Rank | Median Female Earnings |
| Immigrants | Bahamas | 0.0 /100 | #308 | Tragic $35,027 |
| Hondurans | 0.0 /100 | #309 | Tragic $35,013 |
| Chippewa | 0.0 /100 | #310 | Tragic $35,003 |
| Ute | 0.0 /100 | #311 | Tragic $34,960 |
| Yaqui | 0.0 /100 | #312 | Tragic $34,943 |
| Cubans | 0.0 /100 | #313 | Tragic $34,942 |
| Apache | 0.0 /100 | #314 | Tragic $34,895 |
| Pennsylvania Germans | 0.0 /100 | #315 | Tragic $34,802 |
| Cherokee | 0.0 /100 | #316 | Tragic $34,742 |
| Potawatomi | 0.0 /100 | #317 | Tragic $34,739 |
| Immigrants | Yemen | 0.0 /100 | #318 | Tragic $34,693 |
| Shoshone | 0.0 /100 | #319 | Tragic $34,677 |
| Immigrants | Honduras | 0.0 /100 | #320 | Tragic $34,647 |
| Hispanics or Latinos | 0.0 /100 | #321 | Tragic $34,421 |
| Chickasaw | 0.0 /100 | #322 | Tragic $34,414 |