Alaska Native vs Immigrants from Ethiopia Median Female Earnings
COMPARE
Alaska Native
Immigrants from Ethiopia
Median Female Earnings
Median Female Earnings Comparison
Alaska Natives
Immigrants from Ethiopia
$38,202
MEDIAN FEMALE EARNINGS
4.3/ 100
METRIC RATING
238th/ 347
METRIC RANK
$42,744
MEDIAN FEMALE EARNINGS
99.8/ 100
METRIC RATING
70th/ 347
METRIC RANK
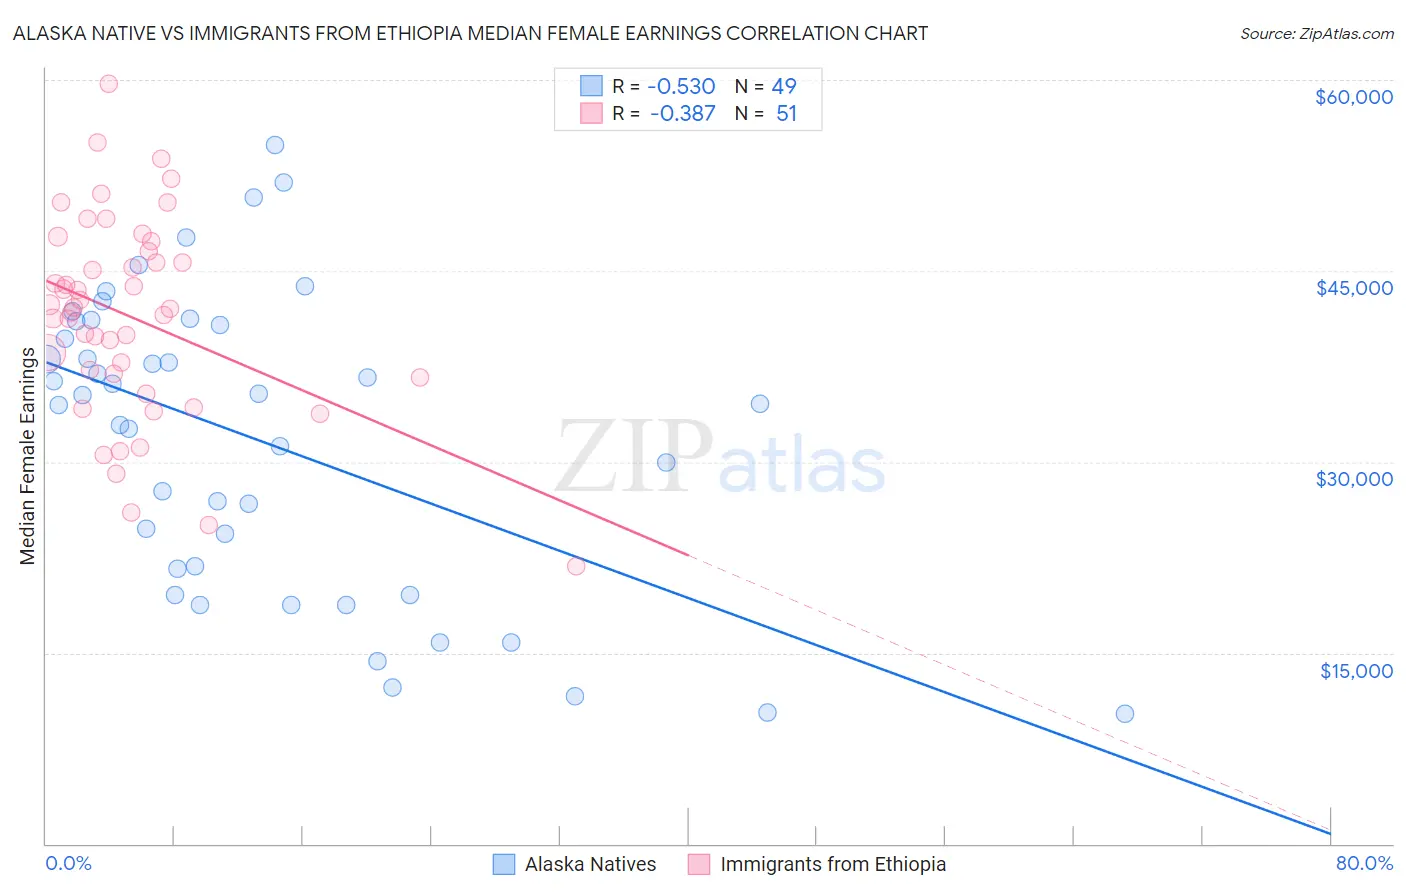
Alaska Native vs Immigrants from Ethiopia Median Female Earnings Correlation Chart
The statistical analysis conducted on geographies consisting of 76,744,414 people shows a substantial negative correlation between the proportion of Alaska Natives and median female earnings in the United States with a correlation coefficient (R) of -0.530 and weighted average of $38,202. Similarly, the statistical analysis conducted on geographies consisting of 211,549,153 people shows a mild negative correlation between the proportion of Immigrants from Ethiopia and median female earnings in the United States with a correlation coefficient (R) of -0.387 and weighted average of $42,744, a difference of 11.9%.
Median Female Earnings Correlation Summary
| Measurement | Alaska Native | Immigrants from Ethiopia |
| Minimum | $10,250 | $21,797 |
| Maximum | $54,922 | $59,671 |
| Range | $44,672 | $37,874 |
| Mean | $31,635 | $41,343 |
| Median | $34,583 | $41,993 |
| Interquartile 25% (IQ1) | $20,573 | $36,641 |
| Interquartile 75% (IQ3) | $40,922 | $46,569 |
| Interquartile Range (IQR) | $20,349 | $9,928 |
| Standard Deviation (Sample) | $11,761 | $7,910 |
| Standard Deviation (Population) | $11,640 | $7,832 |
Similar Demographics by Median Female Earnings
Demographics Similar to Alaska Natives by Median Female Earnings
In terms of median female earnings, the demographic groups most similar to Alaska Natives are Immigrants from Cabo Verde ($38,208, a difference of 0.020%), English ($38,196, a difference of 0.020%), Liberian ($38,215, a difference of 0.030%), Sudanese ($38,215, a difference of 0.040%), and Finnish ($38,173, a difference of 0.080%).
| Demographics | Rating | Rank | Median Female Earnings |
| Somalis | 5.5 /100 | #231 | Tragic $38,333 |
| Scandinavians | 5.2 /100 | #232 | Tragic $38,306 |
| Tongans | 5.1 /100 | #233 | Tragic $38,288 |
| Celtics | 5.0 /100 | #234 | Tragic $38,283 |
| Sudanese | 4.4 /100 | #235 | Tragic $38,215 |
| Liberians | 4.4 /100 | #236 | Tragic $38,215 |
| Immigrants | Cabo Verde | 4.3 /100 | #237 | Tragic $38,208 |
| Alaska Natives | 4.3 /100 | #238 | Tragic $38,202 |
| English | 4.2 /100 | #239 | Tragic $38,196 |
| Finns | 4.0 /100 | #240 | Tragic $38,173 |
| Spanish | 3.5 /100 | #241 | Tragic $38,098 |
| Immigrants | Burma/Myanmar | 3.0 /100 | #242 | Tragic $38,028 |
| Germans | 2.8 /100 | #243 | Tragic $37,986 |
| Immigrants | Liberia | 2.7 /100 | #244 | Tragic $37,970 |
| Immigrants | Middle Africa | 2.7 /100 | #245 | Tragic $37,965 |
Demographics Similar to Immigrants from Ethiopia by Median Female Earnings
In terms of median female earnings, the demographic groups most similar to Immigrants from Ethiopia are Immigrants from Romania ($42,718, a difference of 0.060%), Immigrants from Spain ($42,815, a difference of 0.17%), Immigrants from Austria ($42,824, a difference of 0.19%), Immigrants from Norway ($42,837, a difference of 0.22%), and Immigrants from Egypt ($42,837, a difference of 0.22%).
| Demographics | Rating | Rank | Median Female Earnings |
| Immigrants | Ukraine | 99.9 /100 | #63 | Exceptional $43,069 |
| Immigrants | Pakistan | 99.9 /100 | #64 | Exceptional $43,052 |
| Sierra Leoneans | 99.9 /100 | #65 | Exceptional $42,868 |
| Immigrants | Norway | 99.9 /100 | #66 | Exceptional $42,837 |
| Immigrants | Egypt | 99.9 /100 | #67 | Exceptional $42,837 |
| Immigrants | Austria | 99.8 /100 | #68 | Exceptional $42,824 |
| Immigrants | Spain | 99.8 /100 | #69 | Exceptional $42,815 |
| Immigrants | Ethiopia | 99.8 /100 | #70 | Exceptional $42,744 |
| Immigrants | Romania | 99.8 /100 | #71 | Exceptional $42,718 |
| Albanians | 99.8 /100 | #72 | Exceptional $42,584 |
| Mongolians | 99.7 /100 | #73 | Exceptional $42,542 |
| Immigrants | South Africa | 99.7 /100 | #74 | Exceptional $42,508 |
| New Zealanders | 99.7 /100 | #75 | Exceptional $42,446 |
| Immigrants | Italy | 99.7 /100 | #76 | Exceptional $42,446 |
| Immigrants | Albania | 99.6 /100 | #77 | Exceptional $42,388 |