Slavic vs Immigrants from Ethiopia Male Poverty
COMPARE
Slavic
Immigrants from Ethiopia
Male Poverty
Male Poverty Comparison
Slavs
Immigrants from Ethiopia
10.5%
MALE POVERTY
91.7/ 100
METRIC RATING
103rd/ 347
METRIC RANK
11.2%
MALE POVERTY
50.7/ 100
METRIC RATING
172nd/ 347
METRIC RANK
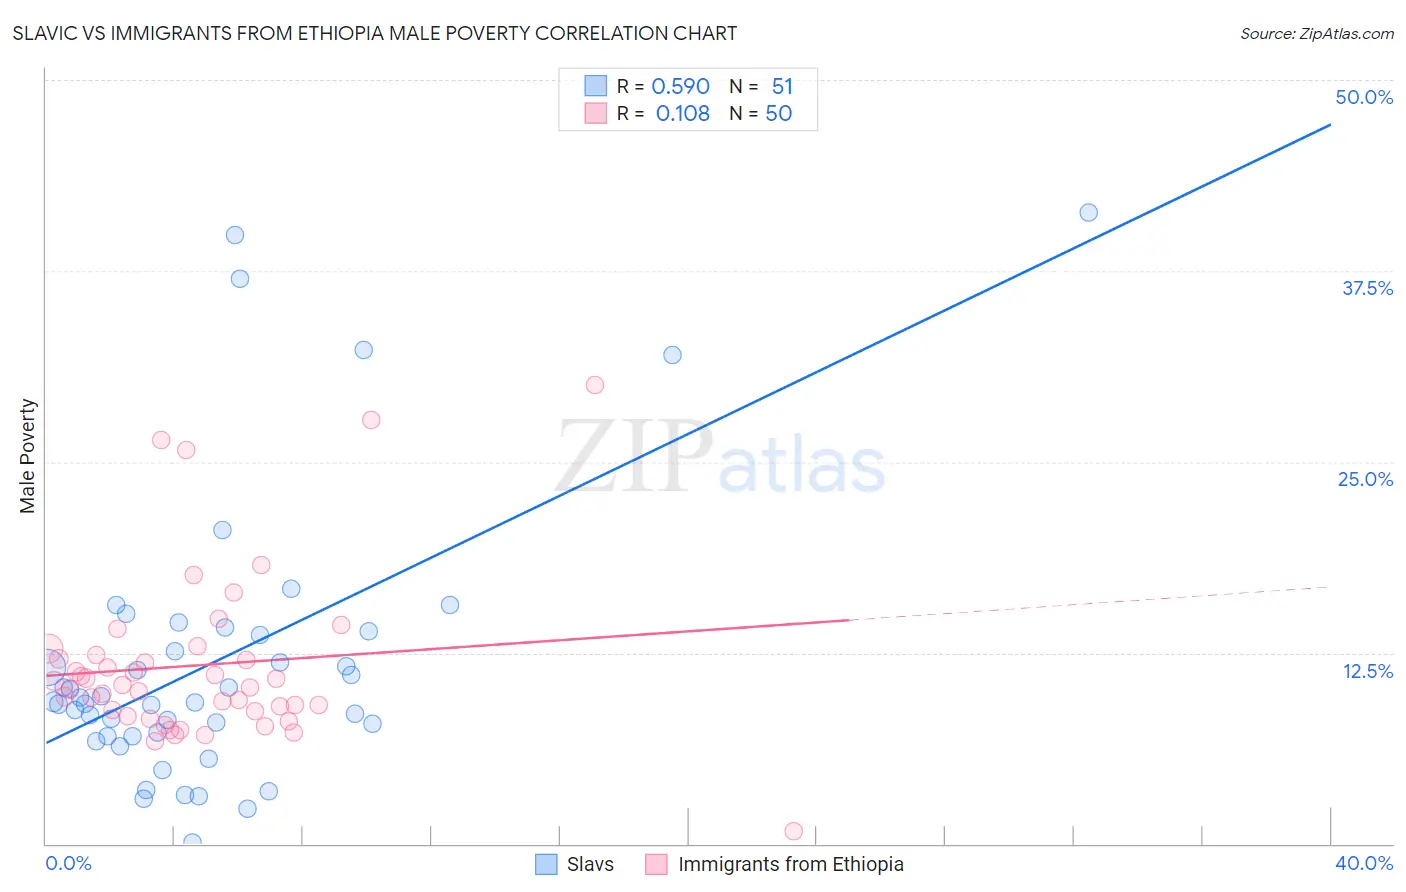
Slavic vs Immigrants from Ethiopia Male Poverty Correlation Chart
The statistical analysis conducted on geographies consisting of 270,742,219 people shows a substantial positive correlation between the proportion of Slavs and poverty level among males in the United States with a correlation coefficient (R) of 0.590 and weighted average of 10.5%. Similarly, the statistical analysis conducted on geographies consisting of 211,452,093 people shows a poor positive correlation between the proportion of Immigrants from Ethiopia and poverty level among males in the United States with a correlation coefficient (R) of 0.108 and weighted average of 11.2%, a difference of 6.2%.
Male Poverty Correlation Summary
| Measurement | Slavic | Immigrants from Ethiopia |
| Minimum | 0.066% | 0.81% |
| Maximum | 41.3% | 30.0% |
| Range | 41.2% | 29.2% |
| Mean | 11.9% | 11.7% |
| Median | 9.3% | 10.3% |
| Interquartile 25% (IQ1) | 7.0% | 8.7% |
| Interquartile 75% (IQ3) | 13.9% | 12.4% |
| Interquartile Range (IQR) | 6.9% | 3.7% |
| Standard Deviation (Sample) | 9.2% | 5.6% |
| Standard Deviation (Population) | 9.1% | 5.5% |
Similar Demographics by Male Poverty
Demographics Similar to Slavs by Male Poverty
In terms of male poverty, the demographic groups most similar to Slavs are Welsh (10.5%, a difference of 0.010%), Canadian (10.5%, a difference of 0.020%), French Canadian (10.5%, a difference of 0.10%), Immigrants from Zimbabwe (10.5%, a difference of 0.11%), and Immigrants from Southern Europe (10.5%, a difference of 0.13%).
| Demographics | Rating | Rank | Male Poverty |
| Immigrants | Egypt | 93.7 /100 | #96 | Exceptional 10.4% |
| Romanians | 93.6 /100 | #97 | Exceptional 10.5% |
| Finns | 93.4 /100 | #98 | Exceptional 10.5% |
| Immigrants | Indonesia | 93.3 /100 | #99 | Exceptional 10.5% |
| Immigrants | Latvia | 92.8 /100 | #100 | Exceptional 10.5% |
| Immigrants | Zimbabwe | 92.0 /100 | #101 | Exceptional 10.5% |
| French Canadians | 91.9 /100 | #102 | Exceptional 10.5% |
| Slavs | 91.7 /100 | #103 | Exceptional 10.5% |
| Welsh | 91.6 /100 | #104 | Exceptional 10.5% |
| Canadians | 91.6 /100 | #105 | Exceptional 10.5% |
| Immigrants | Southern Europe | 91.3 /100 | #106 | Exceptional 10.5% |
| Laotians | 91.2 /100 | #107 | Exceptional 10.5% |
| Portuguese | 91.0 /100 | #108 | Exceptional 10.6% |
| Albanians | 90.6 /100 | #109 | Exceptional 10.6% |
| Argentineans | 90.1 /100 | #110 | Exceptional 10.6% |
Demographics Similar to Immigrants from Ethiopia by Male Poverty
In terms of male poverty, the demographic groups most similar to Immigrants from Ethiopia are Pennsylvania German (11.2%, a difference of 0.020%), Uruguayan (11.2%, a difference of 0.040%), Immigrants from Oceania (11.2%, a difference of 0.070%), South American (11.1%, a difference of 0.30%), and Celtic (11.2%, a difference of 0.32%).
| Demographics | Rating | Rank | Male Poverty |
| Immigrants | Spain | 55.5 /100 | #165 | Average 11.1% |
| Immigrants | Albania | 55.3 /100 | #166 | Average 11.1% |
| Hungarians | 55.1 /100 | #167 | Average 11.1% |
| Immigrants | Portugal | 54.9 /100 | #168 | Average 11.1% |
| Immigrants | Colombia | 54.2 /100 | #169 | Average 11.1% |
| South Americans | 53.8 /100 | #170 | Average 11.1% |
| Uruguayans | 51.0 /100 | #171 | Average 11.2% |
| Immigrants | Ethiopia | 50.7 /100 | #172 | Average 11.2% |
| Pennsylvania Germans | 50.5 /100 | #173 | Average 11.2% |
| Immigrants | Oceania | 50.0 /100 | #174 | Average 11.2% |
| Celtics | 47.5 /100 | #175 | Average 11.2% |
| Immigrants | Fiji | 46.0 /100 | #176 | Average 11.2% |
| Lebanese | 45.6 /100 | #177 | Average 11.2% |
| Immigrants | Cameroon | 44.5 /100 | #178 | Average 11.2% |
| Immigrants | Syria | 40.3 /100 | #179 | Average 11.3% |