Spaniard vs Immigrants from Ethiopia Median Female Earnings
COMPARE
Spaniard
Immigrants from Ethiopia
Median Female Earnings
Median Female Earnings Comparison
Spaniards
Immigrants from Ethiopia
$38,656
MEDIAN FEMALE EARNINGS
10.3/ 100
METRIC RATING
215th/ 347
METRIC RANK
$42,744
MEDIAN FEMALE EARNINGS
99.8/ 100
METRIC RATING
70th/ 347
METRIC RANK
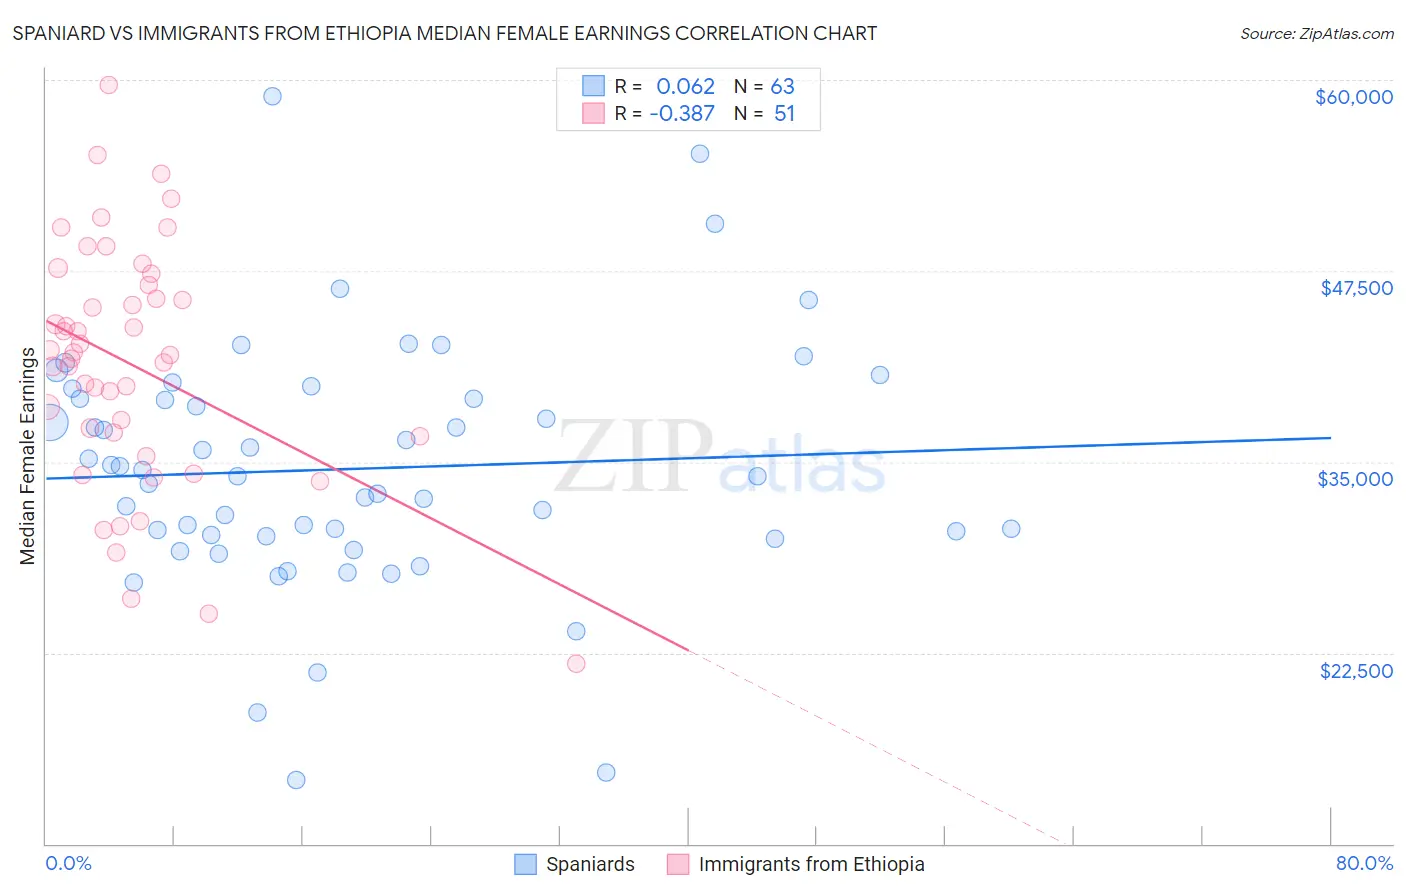
Spaniard vs Immigrants from Ethiopia Median Female Earnings Correlation Chart
The statistical analysis conducted on geographies consisting of 443,223,610 people shows a slight positive correlation between the proportion of Spaniards and median female earnings in the United States with a correlation coefficient (R) of 0.062 and weighted average of $38,656. Similarly, the statistical analysis conducted on geographies consisting of 211,549,153 people shows a mild negative correlation between the proportion of Immigrants from Ethiopia and median female earnings in the United States with a correlation coefficient (R) of -0.387 and weighted average of $42,744, a difference of 10.6%.
Median Female Earnings Correlation Summary
| Measurement | Spaniard | Immigrants from Ethiopia |
| Minimum | $14,192 | $21,797 |
| Maximum | $58,909 | $59,671 |
| Range | $44,717 | $37,874 |
| Mean | $34,527 | $41,343 |
| Median | $34,038 | $41,993 |
| Interquartile 25% (IQ1) | $30,169 | $36,641 |
| Interquartile 75% (IQ3) | $39,139 | $46,569 |
| Interquartile Range (IQR) | $8,970 | $9,928 |
| Standard Deviation (Sample) | $8,078 | $7,910 |
| Standard Deviation (Population) | $8,014 | $7,832 |
Similar Demographics by Median Female Earnings
Demographics Similar to Spaniards by Median Female Earnings
In terms of median female earnings, the demographic groups most similar to Spaniards are Iraqi ($38,666, a difference of 0.020%), Jamaican ($38,670, a difference of 0.030%), Immigrants from Ecuador ($38,644, a difference of 0.030%), Immigrants from Jamaica ($38,625, a difference of 0.080%), and Cape Verdean ($38,614, a difference of 0.11%).
| Demographics | Rating | Rank | Median Female Earnings |
| Immigrants | Thailand | 13.6 /100 | #208 | Poor $38,810 |
| Norwegians | 13.4 /100 | #209 | Poor $38,802 |
| Czechoslovakians | 12.0 /100 | #210 | Poor $38,738 |
| Aleuts | 11.6 /100 | #211 | Poor $38,719 |
| Guamanians/Chamorros | 11.5 /100 | #212 | Poor $38,717 |
| Jamaicans | 10.5 /100 | #213 | Poor $38,670 |
| Iraqis | 10.5 /100 | #214 | Poor $38,666 |
| Spaniards | 10.3 /100 | #215 | Poor $38,656 |
| Immigrants | Ecuador | 10.1 /100 | #216 | Poor $38,644 |
| Immigrants | Jamaica | 9.7 /100 | #217 | Tragic $38,625 |
| Cape Verdeans | 9.5 /100 | #218 | Tragic $38,614 |
| Nepalese | 9.3 /100 | #219 | Tragic $38,603 |
| Yugoslavians | 8.8 /100 | #220 | Tragic $38,573 |
| Immigrants | Azores | 8.8 /100 | #221 | Tragic $38,573 |
| Japanese | 8.1 /100 | #222 | Tragic $38,528 |
Demographics Similar to Immigrants from Ethiopia by Median Female Earnings
In terms of median female earnings, the demographic groups most similar to Immigrants from Ethiopia are Immigrants from Romania ($42,718, a difference of 0.060%), Immigrants from Spain ($42,815, a difference of 0.17%), Immigrants from Austria ($42,824, a difference of 0.19%), Immigrants from Norway ($42,837, a difference of 0.22%), and Immigrants from Egypt ($42,837, a difference of 0.22%).
| Demographics | Rating | Rank | Median Female Earnings |
| Immigrants | Ukraine | 99.9 /100 | #63 | Exceptional $43,069 |
| Immigrants | Pakistan | 99.9 /100 | #64 | Exceptional $43,052 |
| Sierra Leoneans | 99.9 /100 | #65 | Exceptional $42,868 |
| Immigrants | Norway | 99.9 /100 | #66 | Exceptional $42,837 |
| Immigrants | Egypt | 99.9 /100 | #67 | Exceptional $42,837 |
| Immigrants | Austria | 99.8 /100 | #68 | Exceptional $42,824 |
| Immigrants | Spain | 99.8 /100 | #69 | Exceptional $42,815 |
| Immigrants | Ethiopia | 99.8 /100 | #70 | Exceptional $42,744 |
| Immigrants | Romania | 99.8 /100 | #71 | Exceptional $42,718 |
| Albanians | 99.8 /100 | #72 | Exceptional $42,584 |
| Mongolians | 99.7 /100 | #73 | Exceptional $42,542 |
| Immigrants | South Africa | 99.7 /100 | #74 | Exceptional $42,508 |
| New Zealanders | 99.7 /100 | #75 | Exceptional $42,446 |
| Immigrants | Italy | 99.7 /100 | #76 | Exceptional $42,446 |
| Immigrants | Albania | 99.6 /100 | #77 | Exceptional $42,388 |