Belizean vs Immigrants from Ethiopia Median Female Earnings

COMPARE

Belizean
Race
Ancestry
AfghanAfricanAlaska NativeAlaskan AthabascanAlbanianAleutAlsatianAmericanApacheArabArapahoArgentineanArmenianAssyrian/Chaldean/SyriacAustralianAustrianBahamianBangladeshiBarbadianBasqueBelgianBelizeanBermudanBhutaneseBlackfeetBolivianBrazilianBritishBritish West IndianBulgarianBurmeseCajunCambodianCanadianCape VerdeanCarpatho RusynCelticCentral AmericanCentral American IndianCherokeeCheyenneChickasawChileanChineseChippewaChoctawColombianColvilleComancheCosta RicanCreeCreekCroatianCrowCubanCypriotCzechCzechoslovakianDanishDelawareDominicanDutchDutch West IndianEastern EuropeanEcuadorianEgyptianEnglishEstonianEthiopianEuropeanFijianFilipinoFinnishFrenchFrench American IndianFrench CanadianGermanGerman RussianGhanaianGreekGuamanian/ChamorroGuatemalanGuyaneseHaitianHmongHonduranHopiHoumaHungarianIcelanderIndian (Asian)IndonesianInupiatIranianIraqiIrishIroquoisIsraeliItalianJamaicanJapaneseJordanianKenyanKiowaKoreanLaotianLatvianLebaneseLiberianLithuanianLumbeeLuxembourgerMacedonianMalaysianMalteseMarshalleseMenomineeMexicanMexican American IndianMongolianMoroccanNative HawaiianNavajoNepaleseNew ZealanderNicaraguanNigerianNorthern EuropeanNorwegianOkinawanOsageOttawaPaiutePakistaniPalestinianPanamanianParaguayanPennsylvania GermanPeruvianPimaPolishPortuguesePotawatomiPuebloPuerto RicanPuget Sound SalishRomanianRussianSalvadoranSamoanScandinavianScotch-IrishScottishSeminoleSenegaleseSerbianShoshoneSierra LeoneanSiouxSlavicSlovakSloveneSomaliSouth AfricanSouth AmericanSouth American IndianSoviet UnionSpaniardSpanishSpanish AmericanSpanish American IndianSri LankanSubsaharan AfricanSudaneseSwedishSwissSyrianTaiwaneseThaiTlingit-HaidaTohono O'OdhamTonganTrinidadian and TobagonianTsimshianTurkishU.S. Virgin IslanderUgandanUkrainianUruguayanUteVenezuelanVietnameseWelshWest IndianYakamaYaquiYugoslavianYumanYup'ikZimbabwean
Immigration
NonimmigrantsImmigrantsAfghanistanAfricaAlbaniaArgentinaArmeniaAsiaAustraliaAustriaBahamasBangladeshBarbadosBelarusBelgiumBelizeBoliviaBosnia and HerzegovinaBrazilBulgariaBurma/MyanmarCabo VerdeCambodiaCameroonCanadaCaribbeanCentral AmericaChileChinaColombiaCongoCosta RicaCroatiaCubaCzechoslovakiaDenmarkDominicaDominican RepublicEastern AfricaEastern AsiaEastern EuropeEcuadorEgyptEl SalvadorEnglandEritreaEuropeFijiFranceGermanyGhanaGreeceGrenadaGuatemalaGuyanaHaitiHondurasHong KongHungaryIndiaIndonesiaIranIraqIrelandIsraelItalyJamaicaJapanJordanKazakhstanKenyaKoreaKuwaitLaosLatin AmericaLatviaLebanonLiberiaLithuaniaMalaysiaMexicoMicronesiaMiddle AfricaMoldovaMoroccoNepalNetherlandsNicaraguaNigeriaNorth AmericaNorth MacedoniaNorthern AfricaNorthern EuropeNorwayOceaniaPakistanPanamaPeruPhilippinesPolandPortugalRomaniaRussiaSaudi ArabiaScotlandSenegalSerbiaSierra LeoneSingaporeSomaliaSouth AfricaSouth AmericaSouth Central AsiaSouth Eastern AsiaSouthern EuropeSpainSri LankaSt. Vincent and the GrenadinesSudanSwedenSwitzerlandSyriaTaiwanThailandTrinidad and TobagoTurkeyUgandaUkraineUruguayUzbekistanVenezuelaVietnamWest IndiesWestern AfricaWestern AsiaWestern EuropeYemenZaireZimbabweAzores
Immigrants from Ethiopia
Race
Ancestry
AfghanAfricanAlaska NativeAlaskan AthabascanAlbanianAleutAlsatianAmericanApacheArabArapahoArgentineanArmenianAssyrian/Chaldean/SyriacAustralianAustrianBahamianBangladeshiBarbadianBasqueBelgianBermudanBhutaneseBlackfeetBolivianBrazilianBritishBritish West IndianBulgarianBurmeseCajunCambodianCanadianCape VerdeanCarpatho RusynCelticCentral AmericanCentral American IndianCherokeeCheyenneChickasawChileanChineseChippewaChoctawColombianColvilleComancheCosta RicanCreeCreekCroatianCrowCubanCypriotCzechCzechoslovakianDanishDelawareDominicanDutchDutch West IndianEastern EuropeanEcuadorianEgyptianEnglishEstonianEthiopianEuropeanFijianFilipinoFinnishFrenchFrench American IndianFrench CanadianGermanGerman RussianGhanaianGreekGuamanian/ChamorroGuatemalanGuyaneseHaitianHmongHonduranHopiHoumaHungarianIcelanderIndian (Asian)IndonesianInupiatIranianIraqiIrishIroquoisIsraeliItalianJamaicanJapaneseJordanianKenyanKiowaKoreanLaotianLatvianLebaneseLiberianLithuanianLumbeeLuxembourgerMacedonianMalaysianMalteseMarshalleseMenomineeMexicanMexican American IndianMongolianMoroccanNative HawaiianNavajoNepaleseNew ZealanderNicaraguanNigerianNorthern EuropeanNorwegianOkinawanOsageOttawaPaiutePakistaniPalestinianPanamanianParaguayanPennsylvania GermanPeruvianPimaPolishPortuguesePotawatomiPuebloPuerto RicanPuget Sound SalishRomanianRussianSalvadoranSamoanScandinavianScotch-IrishScottishSeminoleSenegaleseSerbianShoshoneSierra LeoneanSiouxSlavicSlovakSloveneSomaliSouth AfricanSouth AmericanSouth American IndianSoviet UnionSpaniardSpanishSpanish AmericanSpanish American IndianSri LankanSubsaharan AfricanSudaneseSwedishSwissSyrianTaiwaneseThaiTlingit-HaidaTohono O'OdhamTonganTrinidadian and TobagonianTsimshianTurkishU.S. Virgin IslanderUgandanUkrainianUruguayanUteVenezuelanVietnameseWelshWest IndianYakamaYaquiYugoslavianYumanYup'ikZimbabwean
Immigration
NonimmigrantsImmigrantsAfghanistanAfricaAlbaniaArgentinaArmeniaAsiaAustraliaAustriaBahamasBangladeshBarbadosBelarusBelgiumBelizeBoliviaBosnia and HerzegovinaBrazilBulgariaBurma/MyanmarCabo VerdeCambodiaCameroonCanadaCaribbeanCentral AmericaChileChinaColombiaCongoCosta RicaCroatiaCubaCzechoslovakiaDenmarkDominicaDominican RepublicEastern AfricaEastern AsiaEastern EuropeEcuadorEgyptEl SalvadorEnglandEritreaEthiopiaEuropeFijiFranceGermanyGhanaGreeceGrenadaGuatemalaGuyanaHaitiHondurasHong KongHungaryIndiaIndonesiaIranIraqIrelandIsraelItalyJamaicaJapanJordanKazakhstanKenyaKoreaKuwaitLaosLatin AmericaLatviaLebanonLiberiaLithuaniaMalaysiaMexicoMicronesiaMiddle AfricaMoldovaMoroccoNepalNetherlandsNicaraguaNigeriaNorth AmericaNorth MacedoniaNorthern AfricaNorthern EuropeNorwayOceaniaPakistanPanamaPeruPhilippinesPolandPortugalRomaniaRussiaSaudi ArabiaScotlandSenegalSerbiaSierra LeoneSingaporeSomaliaSouth AfricaSouth AmericaSouth Central AsiaSouth Eastern AsiaSouthern EuropeSpainSri LankaSt. Vincent and the GrenadinesSudanSwedenSwitzerlandSyriaTaiwanThailandTrinidad and TobagoTurkeyUgandaUkraineUruguayUzbekistanVenezuelaVietnamWest IndiesWestern AfricaWestern AsiaWestern EuropeYemenZaireZimbabweAzores
Median Female Earnings
Income
Poverty
Unemployment
Labor Participation
Family Structure
Vehicle Availability
Education Level
Disability

Median Female Earnings Comparison

Belizeans

Immigrants from Ethiopia

Tragic
Exceptional
$37,429
MEDIAN FEMALE EARNINGS
0.9/ 100
METRIC RATING
258th/ 347
METRIC RANK
$42,744
MEDIAN FEMALE EARNINGS
99.8/ 100
METRIC RATING
70th/ 347
METRIC RANK

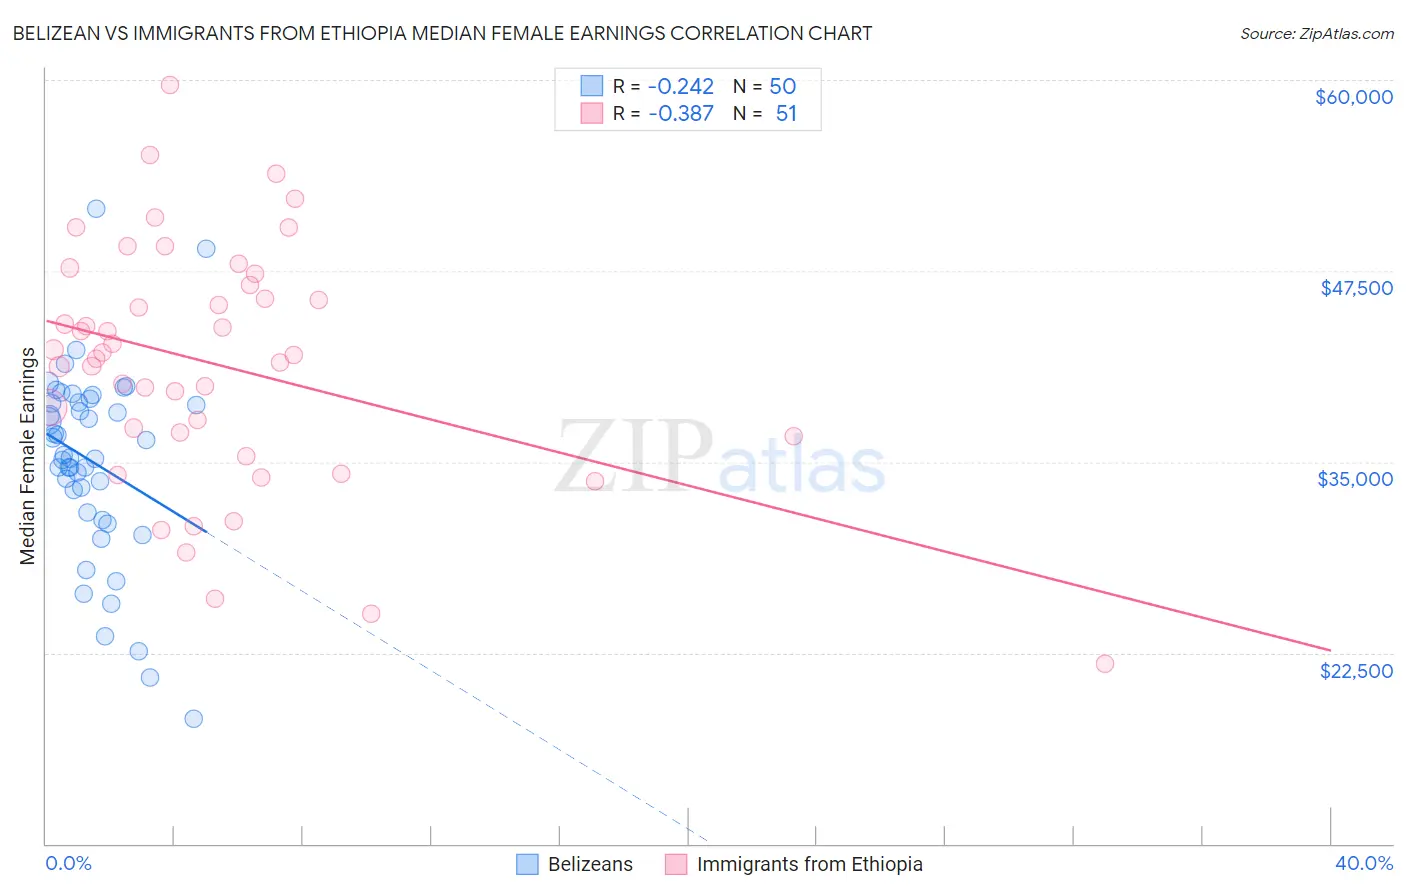
Belizean vs Immigrants from Ethiopia Median Female Earnings Correlation Chart

The statistical analysis conducted on geographies consisting of 144,203,712 people shows a weak negative correlation between the proportion of Belizeans and median female earnings in the United States with a correlation coefficient (R) of -0.242 and weighted average of $37,429. Similarly, the statistical analysis conducted on geographies consisting of 211,549,153 people shows a mild negative correlation between the proportion of Immigrants from Ethiopia and median female earnings in the United States with a correlation coefficient (R) of -0.387 and weighted average of $42,744, a difference of 14.2%.
Belizean vs Immigrants from Ethiopia Median Female Earnings

Median Female Earnings Correlation Summary

MeasurementBelizeanImmigrants from Ethiopia
Minimum$18,201$21,797
Maximum$51,565$59,671
Range$33,364$37,874
Mean$34,988$41,343
Median$35,337$41,993
Interquartile 25% (IQ1)$31,707$36,641
Interquartile 75% (IQ3)$38,920$46,569
Interquartile Range (IQR)$7,213$9,928
Standard Deviation (Sample)$6,353$7,910
Standard Deviation (Population)$6,289$7,832

Similar Demographics by Median Female Earnings

Demographics Similar to Belizeans by Median Female Earnings

In terms of median female earnings, the demographic groups most similar to Belizeans are Scotch-Irish ($37,383, a difference of 0.12%), Hawaiian ($37,497, a difference of 0.18%), Samoan ($37,498, a difference of 0.19%), Colville ($37,514, a difference of 0.23%), and Dutch ($37,339, a difference of 0.24%).
DemographicsRating | RankMedian Female Earnings
Welsh
2.1
/100
|
#251
Tragic
$37,856
Immigrants | Dominica
2.0
/100
|
#252
Tragic
$37,825
Danes
1.6
/100
|
#253
Tragic
$37,730
Whites/Caucasians
1.1
/100
|
#254
Tragic
$37,531
Colville
1.1
/100
|
#255
Tragic
$37,514
Samoans
1.0
/100
|
#256
Tragic
$37,498
Hawaiians
1.0
/100
|
#257
Tragic
$37,497
Belizeans
0.9
/100
|
#258
Tragic
$37,429
Scotch-Irish
0.8
/100
|
#259
Tragic
$37,383
Dutch
0.7
/100
|
#260
Tragic
$37,339
Malaysians
0.7
/100
|
#261
Tragic
$37,298
Venezuelans
0.7
/100
|
#262
Tragic
$37,282
German Russians
0.5
/100
|
#263
Tragic
$37,105
Salvadorans
0.4
/100
|
#264
Tragic
$37,083
Immigrants | Belize
0.4
/100
|
#265
Tragic
$37,056

Demographics Similar to Immigrants from Ethiopia by Median Female Earnings

In terms of median female earnings, the demographic groups most similar to Immigrants from Ethiopia are Immigrants from Romania ($42,718, a difference of 0.060%), Immigrants from Spain ($42,815, a difference of 0.17%), Immigrants from Austria ($42,824, a difference of 0.19%), Immigrants from Norway ($42,837, a difference of 0.22%), and Immigrants from Egypt ($42,837, a difference of 0.22%).
DemographicsRating | RankMedian Female Earnings
Immigrants | Ukraine
99.9
/100
|
#63
Exceptional
$43,069
Immigrants | Pakistan
99.9
/100
|
#64
Exceptional
$43,052
Sierra Leoneans
99.9
/100
|
#65
Exceptional
$42,868
Immigrants | Norway
99.9
/100
|
#66
Exceptional
$42,837
Immigrants | Egypt
99.9
/100
|
#67
Exceptional
$42,837
Immigrants | Austria
99.8
/100
|
#68
Exceptional
$42,824
Immigrants | Spain
99.8
/100
|
#69
Exceptional
$42,815
Immigrants | Ethiopia
99.8
/100
|
#70
Exceptional
$42,744
Immigrants | Romania
99.8
/100
|
#71
Exceptional
$42,718
Albanians
99.8
/100
|
#72
Exceptional
$42,584
Mongolians
99.7
/100
|
#73
Exceptional
$42,542
Immigrants | South Africa
99.7
/100
|
#74
Exceptional
$42,508
New Zealanders
99.7
/100
|
#75
Exceptional
$42,446
Immigrants | Italy
99.7
/100
|
#76
Exceptional
$42,446
Immigrants | Albania
99.6
/100
|
#77
Exceptional
$42,388