Dominican vs Immigrants from Poland Wage/Income Gap
COMPARE
Dominican
Immigrants from Poland
Wage/Income Gap
Wage/Income Gap Comparison
Dominicans
Immigrants from Poland
20.6%
WAGE/INCOME GAP
100.0/ 100
METRIC RATING
24th/ 347
METRIC RANK
26.7%
WAGE/INCOME GAP
8.9/ 100
METRIC RATING
219th/ 347
METRIC RANK
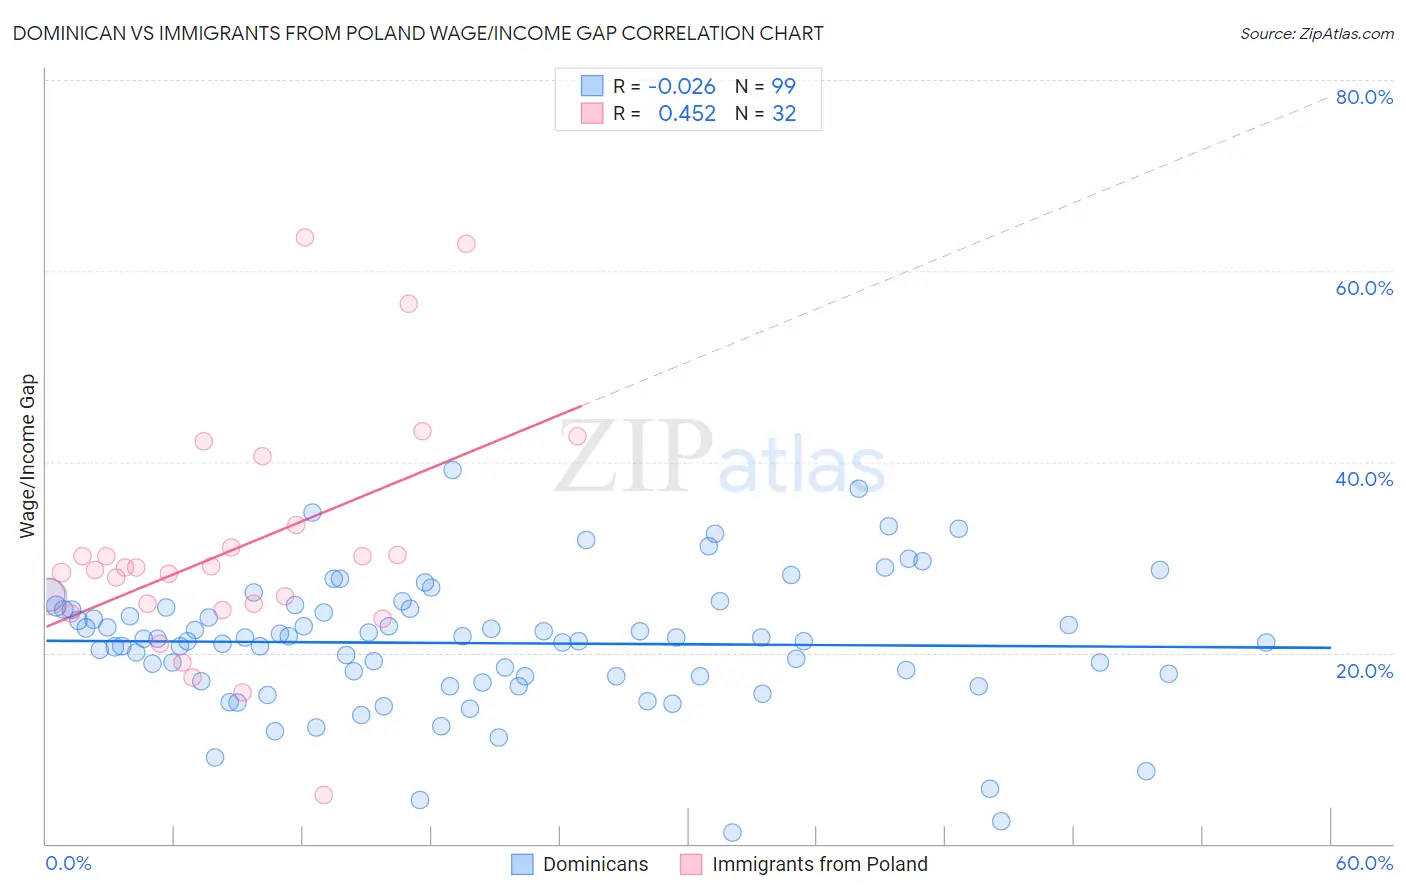
Dominican vs Immigrants from Poland Wage/Income Gap Correlation Chart
The statistical analysis conducted on geographies consisting of 354,862,114 people shows no correlation between the proportion of Dominicans and wage/income gap percentage in the United States with a correlation coefficient (R) of -0.026 and weighted average of 20.6%. Similarly, the statistical analysis conducted on geographies consisting of 304,701,845 people shows a moderate positive correlation between the proportion of Immigrants from Poland and wage/income gap percentage in the United States with a correlation coefficient (R) of 0.452 and weighted average of 26.7%, a difference of 29.9%.
Wage/Income Gap Correlation Summary
| Measurement | Dominican | Immigrants from Poland |
| Minimum | 1.2% | 5.1% |
| Maximum | 39.2% | 63.5% |
| Range | 37.9% | 58.4% |
| Mean | 21.0% | 30.9% |
| Median | 21.4% | 28.8% |
| Interquartile 25% (IQ1) | 17.5% | 24.8% |
| Interquartile 75% (IQ3) | 24.7% | 32.3% |
| Interquartile Range (IQR) | 7.2% | 7.5% |
| Standard Deviation (Sample) | 6.9% | 12.5% |
| Standard Deviation (Population) | 6.8% | 12.3% |
Similar Demographics by Wage/Income Gap
Demographics Similar to Dominicans by Wage/Income Gap
In terms of wage/income gap, the demographic groups most similar to Dominicans are Immigrants from Dominican Republic (20.6%, a difference of 0.17%), Immigrants from Liberia (20.6%, a difference of 0.19%), Senegalese (20.7%, a difference of 0.30%), Pueblo (20.7%, a difference of 0.41%), and Immigrants from Armenia (20.7%, a difference of 0.62%).
| Demographics | Rating | Rank | Wage/Income Gap |
| Haitians | 100.0 /100 | #17 | Exceptional 19.7% |
| Hopi | 100.0 /100 | #18 | Exceptional 20.0% |
| Immigrants | Dominica | 100.0 /100 | #19 | Exceptional 20.0% |
| Bahamians | 100.0 /100 | #20 | Exceptional 20.2% |
| Immigrants | Caribbean | 100.0 /100 | #21 | Exceptional 20.4% |
| Immigrants | Liberia | 100.0 /100 | #22 | Exceptional 20.6% |
| Immigrants | Dominican Republic | 100.0 /100 | #23 | Exceptional 20.6% |
| Dominicans | 100.0 /100 | #24 | Exceptional 20.6% |
| Senegalese | 100.0 /100 | #25 | Exceptional 20.7% |
| Pueblo | 100.0 /100 | #26 | Exceptional 20.7% |
| Immigrants | Armenia | 100.0 /100 | #27 | Exceptional 20.7% |
| Inupiat | 100.0 /100 | #28 | Exceptional 20.8% |
| Immigrants | Senegal | 100.0 /100 | #29 | Exceptional 20.9% |
| Immigrants | Bangladesh | 100.0 /100 | #30 | Exceptional 20.9% |
| Vietnamese | 100.0 /100 | #31 | Exceptional 21.0% |
Demographics Similar to Immigrants from Poland by Wage/Income Gap
In terms of wage/income gap, the demographic groups most similar to Immigrants from Poland are Immigrants from Latvia (26.7%, a difference of 0.010%), Immigrants from Saudi Arabia (26.7%, a difference of 0.030%), Brazilian (26.7%, a difference of 0.050%), Immigrants from Spain (26.8%, a difference of 0.080%), and Immigrants from Portugal (26.7%, a difference of 0.11%).
| Demographics | Rating | Rank | Wage/Income Gap |
| Iraqis | 11.2 /100 | #212 | Poor 26.6% |
| Immigrants | Iraq | 10.3 /100 | #213 | Poor 26.7% |
| Immigrants | China | 10.3 /100 | #214 | Poor 26.7% |
| Yugoslavians | 9.7 /100 | #215 | Tragic 26.7% |
| Immigrants | Portugal | 9.5 /100 | #216 | Tragic 26.7% |
| Brazilians | 9.2 /100 | #217 | Tragic 26.7% |
| Immigrants | Saudi Arabia | 9.1 /100 | #218 | Tragic 26.7% |
| Immigrants | Poland | 8.9 /100 | #219 | Tragic 26.7% |
| Immigrants | Latvia | 8.9 /100 | #220 | Tragic 26.7% |
| Immigrants | Spain | 8.5 /100 | #221 | Tragic 26.8% |
| Bolivians | 8.3 /100 | #222 | Tragic 26.8% |
| Jordanians | 8.0 /100 | #223 | Tragic 26.8% |
| Immigrants | Argentina | 7.2 /100 | #224 | Tragic 26.8% |
| Immigrants | Ireland | 6.5 /100 | #225 | Tragic 26.9% |
| Asians | 5.9 /100 | #226 | Tragic 26.9% |