Scotch-Irish vs Immigrants from Trinidad and Tobago Wage/Income Gap
COMPARE
Scotch-Irish
Immigrants from Trinidad and Tobago
Wage/Income Gap
Wage/Income Gap Comparison
Scotch-Irish
Immigrants from Trinidad and Tobago
28.5%
WAGE/INCOME GAP
0.2/ 100
METRIC RATING
302nd/ 347
METRIC RANK
19.3%
WAGE/INCOME GAP
100.0/ 100
METRIC RATING
14th/ 347
METRIC RANK
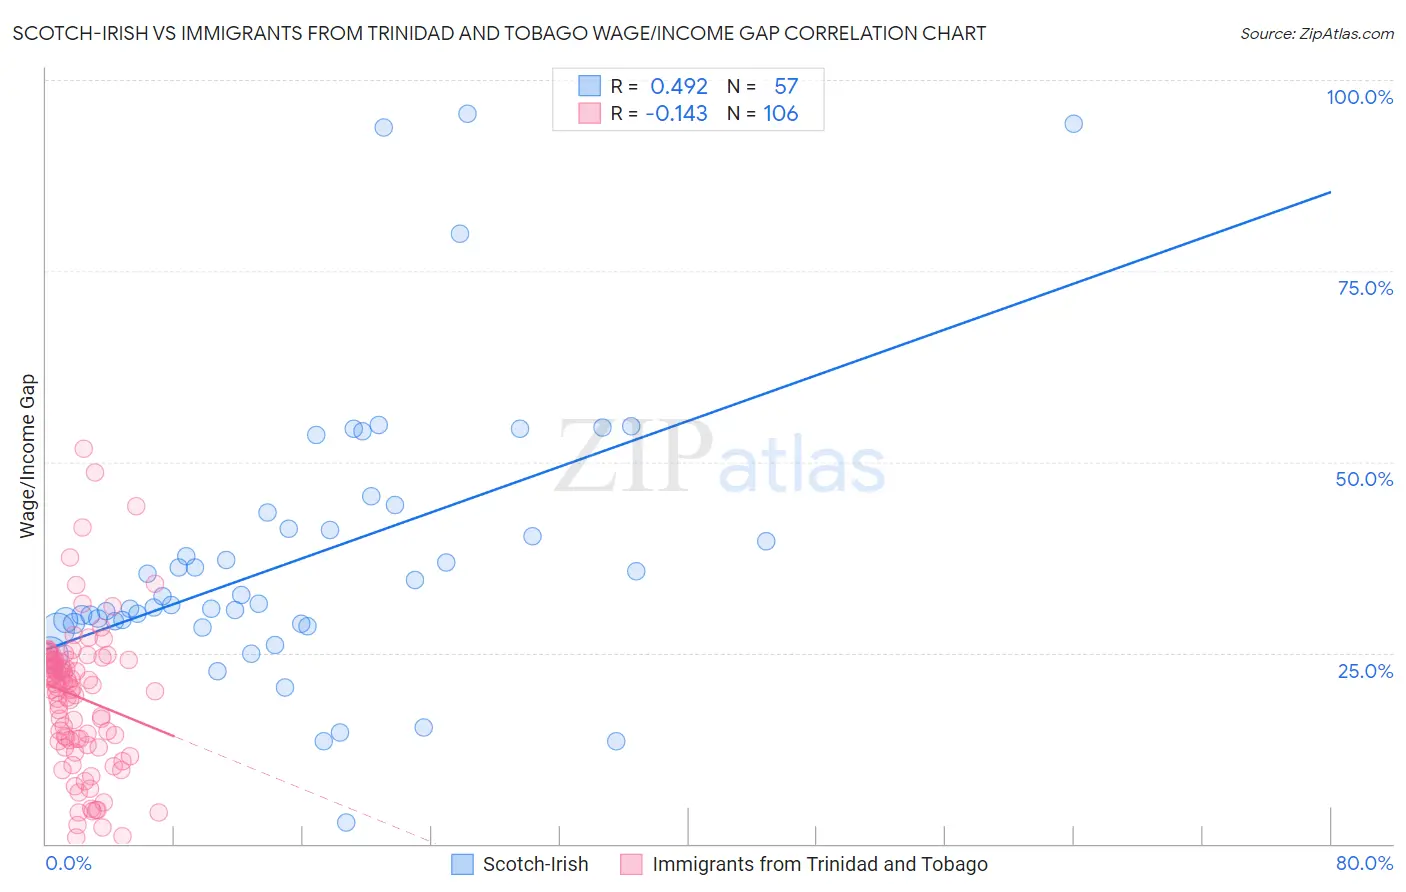
Scotch-Irish vs Immigrants from Trinidad and Tobago Wage/Income Gap Correlation Chart
The statistical analysis conducted on geographies consisting of 546,535,842 people shows a moderate positive correlation between the proportion of Scotch-Irish and wage/income gap percentage in the United States with a correlation coefficient (R) of 0.492 and weighted average of 28.5%. Similarly, the statistical analysis conducted on geographies consisting of 223,459,768 people shows a poor negative correlation between the proportion of Immigrants from Trinidad and Tobago and wage/income gap percentage in the United States with a correlation coefficient (R) of -0.143 and weighted average of 19.3%, a difference of 47.3%.
Wage/Income Gap Correlation Summary
| Measurement | Scotch-Irish | Immigrants from Trinidad and Tobago |
| Minimum | 2.8% | 0.88% |
| Maximum | 95.6% | 51.8% |
| Range | 92.8% | 50.9% |
| Mean | 37.5% | 19.2% |
| Median | 31.4% | 20.6% |
| Interquartile 25% (IQ1) | 28.8% | 13.4% |
| Interquartile 75% (IQ3) | 42.3% | 24.1% |
| Interquartile Range (IQR) | 13.5% | 10.7% |
| Standard Deviation (Sample) | 18.6% | 9.5% |
| Standard Deviation (Population) | 18.4% | 9.5% |
Similar Demographics by Wage/Income Gap
Demographics Similar to Scotch-Irish by Wage/Income Gap
In terms of wage/income gap, the demographic groups most similar to Scotch-Irish are Irish (28.5%, a difference of 0.0%), Immigrants from Canada (28.5%, a difference of 0.030%), Immigrants from Northern Europe (28.5%, a difference of 0.070%), Immigrants from Netherlands (28.5%, a difference of 0.080%), and Immigrants from South Africa (28.5%, a difference of 0.10%).
| Demographics | Rating | Rank | Wage/Income Gap |
| Slovenes | 0.3 /100 | #295 | Tragic 28.3% |
| Northern Europeans | 0.3 /100 | #296 | Tragic 28.3% |
| Immigrants | North America | 0.2 /100 | #297 | Tragic 28.4% |
| Austrians | 0.2 /100 | #298 | Tragic 28.4% |
| Immigrants | North Macedonia | 0.2 /100 | #299 | Tragic 28.4% |
| Immigrants | Northern Europe | 0.2 /100 | #300 | Tragic 28.5% |
| Immigrants | Canada | 0.2 /100 | #301 | Tragic 28.5% |
| Scotch-Irish | 0.2 /100 | #302 | Tragic 28.5% |
| Irish | 0.2 /100 | #303 | Tragic 28.5% |
| Immigrants | Netherlands | 0.2 /100 | #304 | Tragic 28.5% |
| Immigrants | South Africa | 0.1 /100 | #305 | Tragic 28.5% |
| Whites/Caucasians | 0.1 /100 | #306 | Tragic 28.5% |
| Immigrants | Denmark | 0.1 /100 | #307 | Tragic 28.5% |
| Poles | 0.1 /100 | #308 | Tragic 28.5% |
| Macedonians | 0.1 /100 | #309 | Tragic 28.6% |
Demographics Similar to Immigrants from Trinidad and Tobago by Wage/Income Gap
In terms of wage/income gap, the demographic groups most similar to Immigrants from Trinidad and Tobago are Trinidadian and Tobagonian (19.3%, a difference of 0.050%), Immigrants from West Indies (19.2%, a difference of 0.53%), Immigrants from Haiti (19.2%, a difference of 0.64%), West Indian (19.6%, a difference of 1.2%), and Jamaican (19.6%, a difference of 1.3%).
| Demographics | Rating | Rank | Wage/Income Gap |
| Puerto Ricans | 100.0 /100 | #7 | Exceptional 18.7% |
| Immigrants | Jamaica | 100.0 /100 | #8 | Exceptional 18.8% |
| Barbadians | 100.0 /100 | #9 | Exceptional 19.0% |
| Crow | 100.0 /100 | #10 | Exceptional 19.1% |
| Immigrants | Haiti | 100.0 /100 | #11 | Exceptional 19.2% |
| Immigrants | West Indies | 100.0 /100 | #12 | Exceptional 19.2% |
| Trinidadians and Tobagonians | 100.0 /100 | #13 | Exceptional 19.3% |
| Immigrants | Trinidad and Tobago | 100.0 /100 | #14 | Exceptional 19.3% |
| West Indians | 100.0 /100 | #15 | Exceptional 19.6% |
| Jamaicans | 100.0 /100 | #16 | Exceptional 19.6% |
| Haitians | 100.0 /100 | #17 | Exceptional 19.7% |
| Hopi | 100.0 /100 | #18 | Exceptional 20.0% |
| Immigrants | Dominica | 100.0 /100 | #19 | Exceptional 20.0% |
| Bahamians | 100.0 /100 | #20 | Exceptional 20.2% |
| Immigrants | Caribbean | 100.0 /100 | #21 | Exceptional 20.4% |