Potawatomi vs Immigrants from Kenya Per Capita Income
COMPARE
Potawatomi
Immigrants from Kenya
Per Capita Income
Per Capita Income Comparison
Potawatomi
Immigrants from Kenya
$38,046
PER CAPITA INCOME
0.2/ 100
METRIC RATING
280th/ 347
METRIC RANK
$42,661
PER CAPITA INCOME
24.5/ 100
METRIC RATING
195th/ 347
METRIC RANK
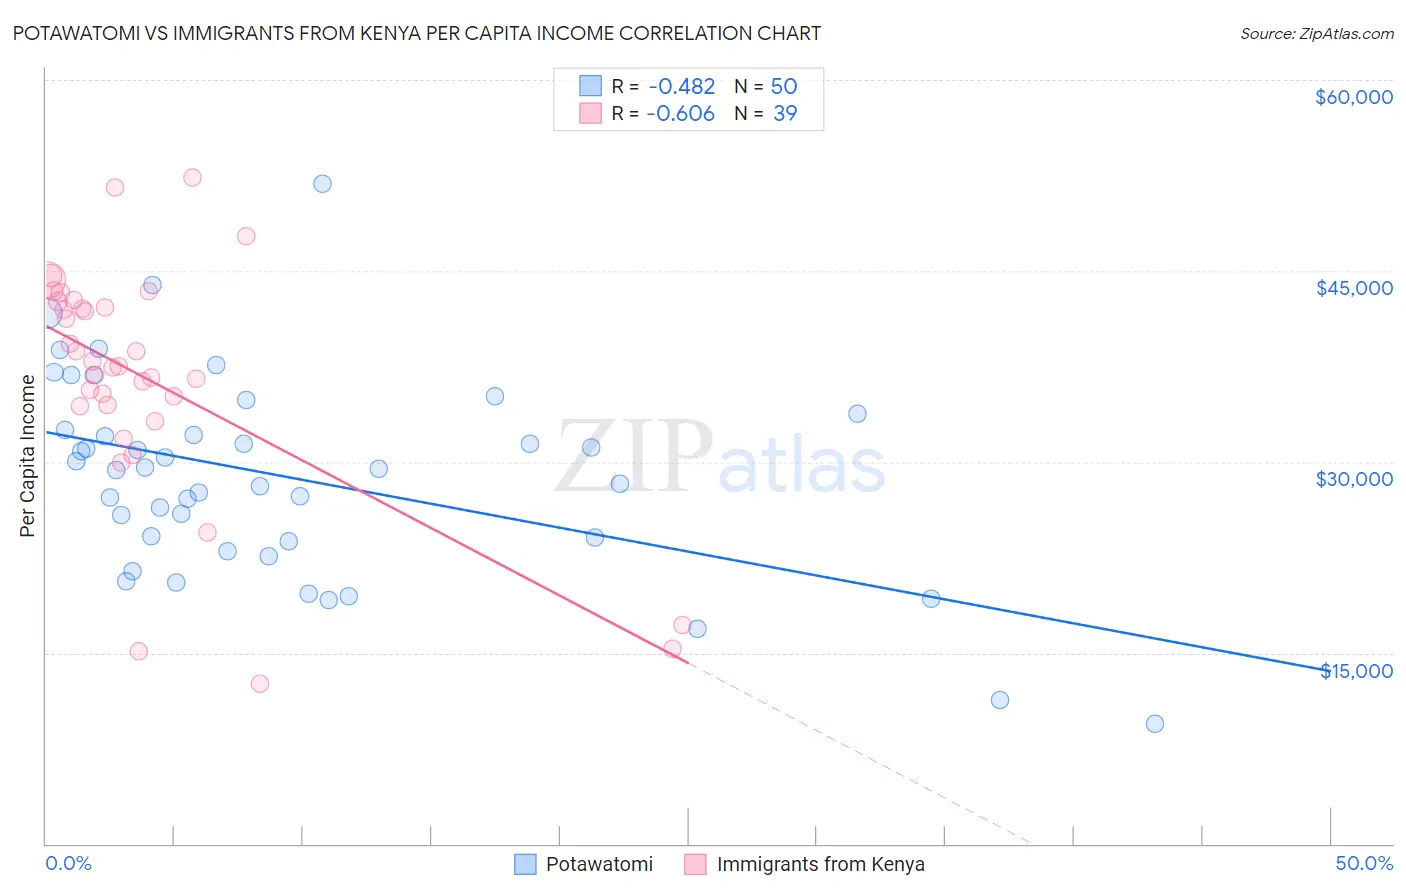
Potawatomi vs Immigrants from Kenya Per Capita Income Correlation Chart
The statistical analysis conducted on geographies consisting of 117,768,459 people shows a moderate negative correlation between the proportion of Potawatomi and per capita income in the United States with a correlation coefficient (R) of -0.482 and weighted average of $38,046. Similarly, the statistical analysis conducted on geographies consisting of 218,088,473 people shows a significant negative correlation between the proportion of Immigrants from Kenya and per capita income in the United States with a correlation coefficient (R) of -0.606 and weighted average of $42,661, a difference of 12.1%.
Per Capita Income Correlation Summary
| Measurement | Potawatomi | Immigrants from Kenya |
| Minimum | $9,447 | $12,576 |
| Maximum | $51,870 | $52,346 |
| Range | $42,423 | $39,770 |
| Mean | $28,766 | $36,572 |
| Median | $29,420 | $37,555 |
| Interquartile 25% (IQ1) | $23,768 | $34,356 |
| Interquartile 75% (IQ3) | $32,549 | $42,624 |
| Interquartile Range (IQR) | $8,781 | $8,268 |
| Standard Deviation (Sample) | $7,980 | $9,228 |
| Standard Deviation (Population) | $7,900 | $9,109 |
Similar Demographics by Per Capita Income
Demographics Similar to Potawatomi by Per Capita Income
In terms of per capita income, the demographic groups most similar to Potawatomi are Colville ($38,047, a difference of 0.0%), Immigrants from Nicaragua ($38,065, a difference of 0.050%), Comanche ($38,088, a difference of 0.11%), Hmong ($38,120, a difference of 0.20%), and Immigrants from Dominica ($37,952, a difference of 0.25%).
| Demographics | Rating | Rank | Per Capita Income |
| Nepalese | 0.3 /100 | #273 | Tragic $38,442 |
| Immigrants | El Salvador | 0.3 /100 | #274 | Tragic $38,394 |
| Immigrants | Liberia | 0.2 /100 | #275 | Tragic $38,165 |
| Hmong | 0.2 /100 | #276 | Tragic $38,120 |
| Comanche | 0.2 /100 | #277 | Tragic $38,088 |
| Immigrants | Nicaragua | 0.2 /100 | #278 | Tragic $38,065 |
| Colville | 0.2 /100 | #279 | Tragic $38,047 |
| Potawatomi | 0.2 /100 | #280 | Tragic $38,046 |
| Immigrants | Dominica | 0.2 /100 | #281 | Tragic $37,952 |
| Immigrants | Laos | 0.1 /100 | #282 | Tragic $37,857 |
| Pennsylvania Germans | 0.1 /100 | #283 | Tragic $37,842 |
| Africans | 0.1 /100 | #284 | Tragic $37,785 |
| Guatemalans | 0.1 /100 | #285 | Tragic $37,766 |
| Central American Indians | 0.1 /100 | #286 | Tragic $37,699 |
| Dominicans | 0.1 /100 | #287 | Tragic $37,697 |
Demographics Similar to Immigrants from Kenya by Per Capita Income
In terms of per capita income, the demographic groups most similar to Immigrants from Kenya are Immigrants from Fiji ($42,694, a difference of 0.080%), Dutch ($42,605, a difference of 0.13%), Immigrants from Sierra Leone ($42,752, a difference of 0.21%), Iraqi ($42,760, a difference of 0.23%), and Scotch-Irish ($42,563, a difference of 0.23%).
| Demographics | Rating | Rank | Per Capita Income |
| Immigrants | Africa | 31.0 /100 | #188 | Fair $42,950 |
| Bermudans | 30.1 /100 | #189 | Fair $42,911 |
| Kenyans | 27.7 /100 | #190 | Fair $42,808 |
| Yugoslavians | 27.4 /100 | #191 | Fair $42,792 |
| Iraqis | 26.7 /100 | #192 | Fair $42,760 |
| Immigrants | Sierra Leone | 26.5 /100 | #193 | Fair $42,752 |
| Immigrants | Fiji | 25.2 /100 | #194 | Fair $42,694 |
| Immigrants | Kenya | 24.5 /100 | #195 | Fair $42,661 |
| Dutch | 23.4 /100 | #196 | Fair $42,605 |
| Scotch-Irish | 22.6 /100 | #197 | Fair $42,563 |
| Immigrants | Portugal | 19.7 /100 | #198 | Poor $42,412 |
| Barbadians | 19.6 /100 | #199 | Poor $42,406 |
| Vietnamese | 19.0 /100 | #200 | Poor $42,368 |
| Immigrants | Thailand | 17.6 /100 | #201 | Poor $42,289 |
| Immigrants | Bosnia and Herzegovina | 17.5 /100 | #202 | Poor $42,278 |