Potawatomi vs Immigrants from Cameroon Per Capita Income
COMPARE
Potawatomi
Immigrants from Cameroon
Per Capita Income
Per Capita Income Comparison
Potawatomi
Immigrants from Cameroon
$38,046
PER CAPITA INCOME
0.2/ 100
METRIC RATING
280th/ 347
METRIC RANK
$41,334
PER CAPITA INCOME
6.8/ 100
METRIC RATING
223rd/ 347
METRIC RANK
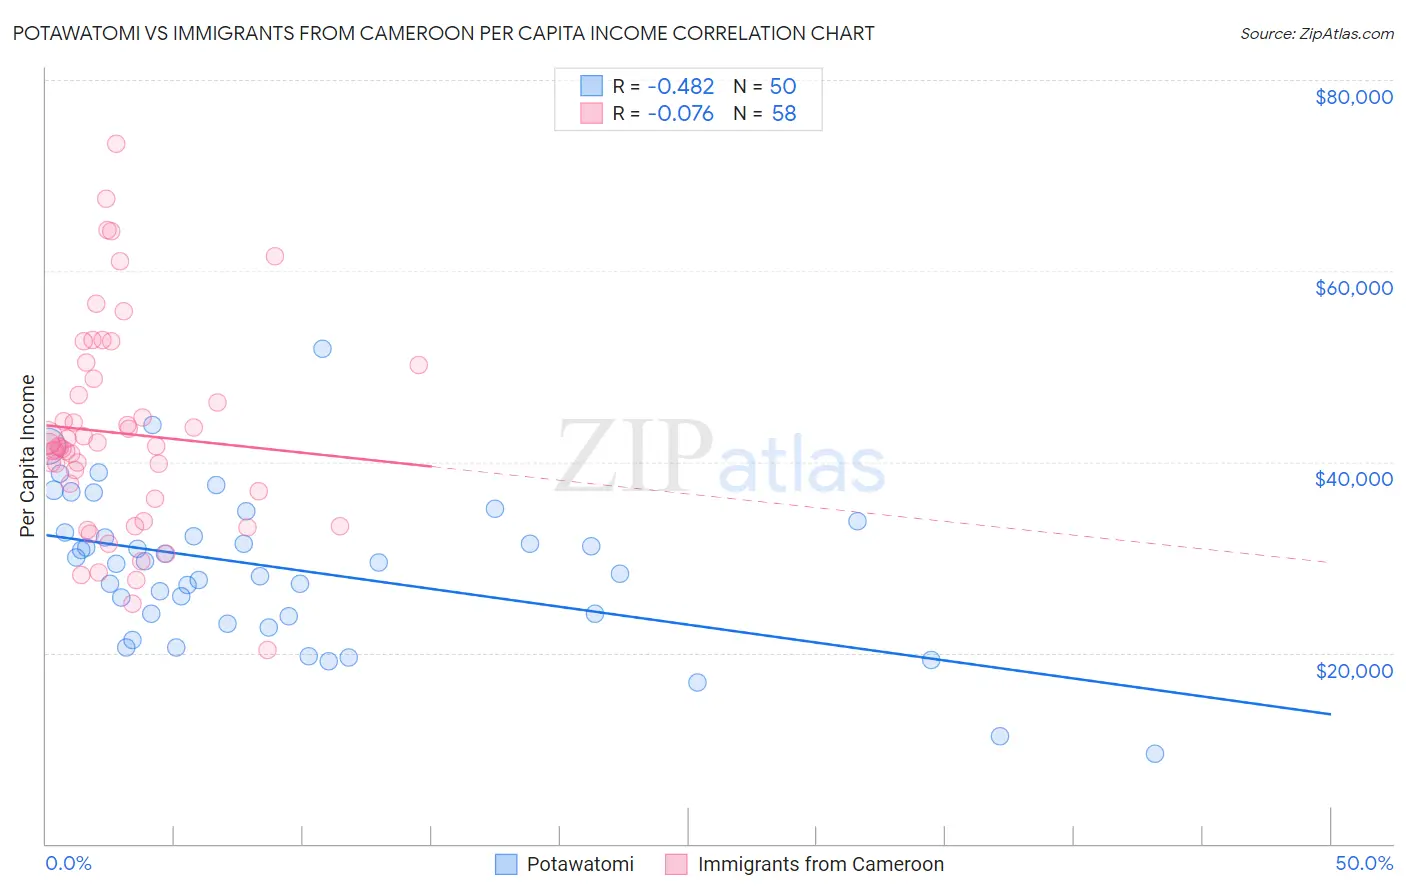
Potawatomi vs Immigrants from Cameroon Per Capita Income Correlation Chart
The statistical analysis conducted on geographies consisting of 117,768,459 people shows a moderate negative correlation between the proportion of Potawatomi and per capita income in the United States with a correlation coefficient (R) of -0.482 and weighted average of $38,046. Similarly, the statistical analysis conducted on geographies consisting of 130,769,320 people shows a slight negative correlation between the proportion of Immigrants from Cameroon and per capita income in the United States with a correlation coefficient (R) of -0.076 and weighted average of $41,334, a difference of 8.6%.
Per Capita Income Correlation Summary
| Measurement | Potawatomi | Immigrants from Cameroon |
| Minimum | $9,447 | $20,282 |
| Maximum | $51,870 | $73,301 |
| Range | $42,423 | $53,019 |
| Mean | $28,766 | $42,979 |
| Median | $29,420 | $41,647 |
| Interquartile 25% (IQ1) | $23,768 | $36,092 |
| Interquartile 75% (IQ3) | $32,549 | $48,673 |
| Interquartile Range (IQR) | $8,781 | $12,582 |
| Standard Deviation (Sample) | $7,980 | $10,877 |
| Standard Deviation (Population) | $7,900 | $10,783 |
Similar Demographics by Per Capita Income
Demographics Similar to Potawatomi by Per Capita Income
In terms of per capita income, the demographic groups most similar to Potawatomi are Colville ($38,047, a difference of 0.0%), Immigrants from Nicaragua ($38,065, a difference of 0.050%), Comanche ($38,088, a difference of 0.11%), Hmong ($38,120, a difference of 0.20%), and Immigrants from Dominica ($37,952, a difference of 0.25%).
| Demographics | Rating | Rank | Per Capita Income |
| Nepalese | 0.3 /100 | #273 | Tragic $38,442 |
| Immigrants | El Salvador | 0.3 /100 | #274 | Tragic $38,394 |
| Immigrants | Liberia | 0.2 /100 | #275 | Tragic $38,165 |
| Hmong | 0.2 /100 | #276 | Tragic $38,120 |
| Comanche | 0.2 /100 | #277 | Tragic $38,088 |
| Immigrants | Nicaragua | 0.2 /100 | #278 | Tragic $38,065 |
| Colville | 0.2 /100 | #279 | Tragic $38,047 |
| Potawatomi | 0.2 /100 | #280 | Tragic $38,046 |
| Immigrants | Dominica | 0.2 /100 | #281 | Tragic $37,952 |
| Immigrants | Laos | 0.1 /100 | #282 | Tragic $37,857 |
| Pennsylvania Germans | 0.1 /100 | #283 | Tragic $37,842 |
| Africans | 0.1 /100 | #284 | Tragic $37,785 |
| Guatemalans | 0.1 /100 | #285 | Tragic $37,766 |
| Central American Indians | 0.1 /100 | #286 | Tragic $37,699 |
| Dominicans | 0.1 /100 | #287 | Tragic $37,697 |
Demographics Similar to Immigrants from Cameroon by Per Capita Income
In terms of per capita income, the demographic groups most similar to Immigrants from Cameroon are Immigrants from Iraq ($41,365, a difference of 0.070%), Immigrants from St. Vincent and the Grenadines ($41,270, a difference of 0.16%), West Indian ($41,217, a difference of 0.28%), Immigrants from Trinidad and Tobago ($41,476, a difference of 0.34%), and Immigrants from Ecuador ($41,195, a difference of 0.34%).
| Demographics | Rating | Rank | Per Capita Income |
| Tongans | 9.9 /100 | #216 | Tragic $41,693 |
| Guamanians/Chamorros | 9.7 /100 | #217 | Tragic $41,678 |
| Trinidadians and Tobagonians | 9.5 /100 | #218 | Tragic $41,655 |
| Puget Sound Salish | 8.1 /100 | #219 | Tragic $41,495 |
| Immigrants | Barbados | 7.9 /100 | #220 | Tragic $41,478 |
| Immigrants | Trinidad and Tobago | 7.9 /100 | #221 | Tragic $41,476 |
| Immigrants | Iraq | 7.1 /100 | #222 | Tragic $41,365 |
| Immigrants | Cameroon | 6.8 /100 | #223 | Tragic $41,334 |
| Immigrants | St. Vincent and the Grenadines | 6.4 /100 | #224 | Tragic $41,270 |
| West Indians | 6.0 /100 | #225 | Tragic $41,217 |
| Immigrants | Ecuador | 5.9 /100 | #226 | Tragic $41,195 |
| Immigrants | Ghana | 5.5 /100 | #227 | Tragic $41,131 |
| Immigrants | Grenada | 5.5 /100 | #228 | Tragic $41,123 |
| Nigerians | 4.9 /100 | #229 | Tragic $41,026 |
| Native Hawaiians | 4.9 /100 | #230 | Tragic $41,017 |