Potawatomi vs Immigrants from Albania Per Capita Income
COMPARE
Potawatomi
Immigrants from Albania
Per Capita Income
Per Capita Income Comparison
Potawatomi
Immigrants from Albania
$38,046
PER CAPITA INCOME
0.2/ 100
METRIC RATING
280th/ 347
METRIC RANK
$46,387
PER CAPITA INCOME
95.5/ 100
METRIC RATING
113th/ 347
METRIC RANK
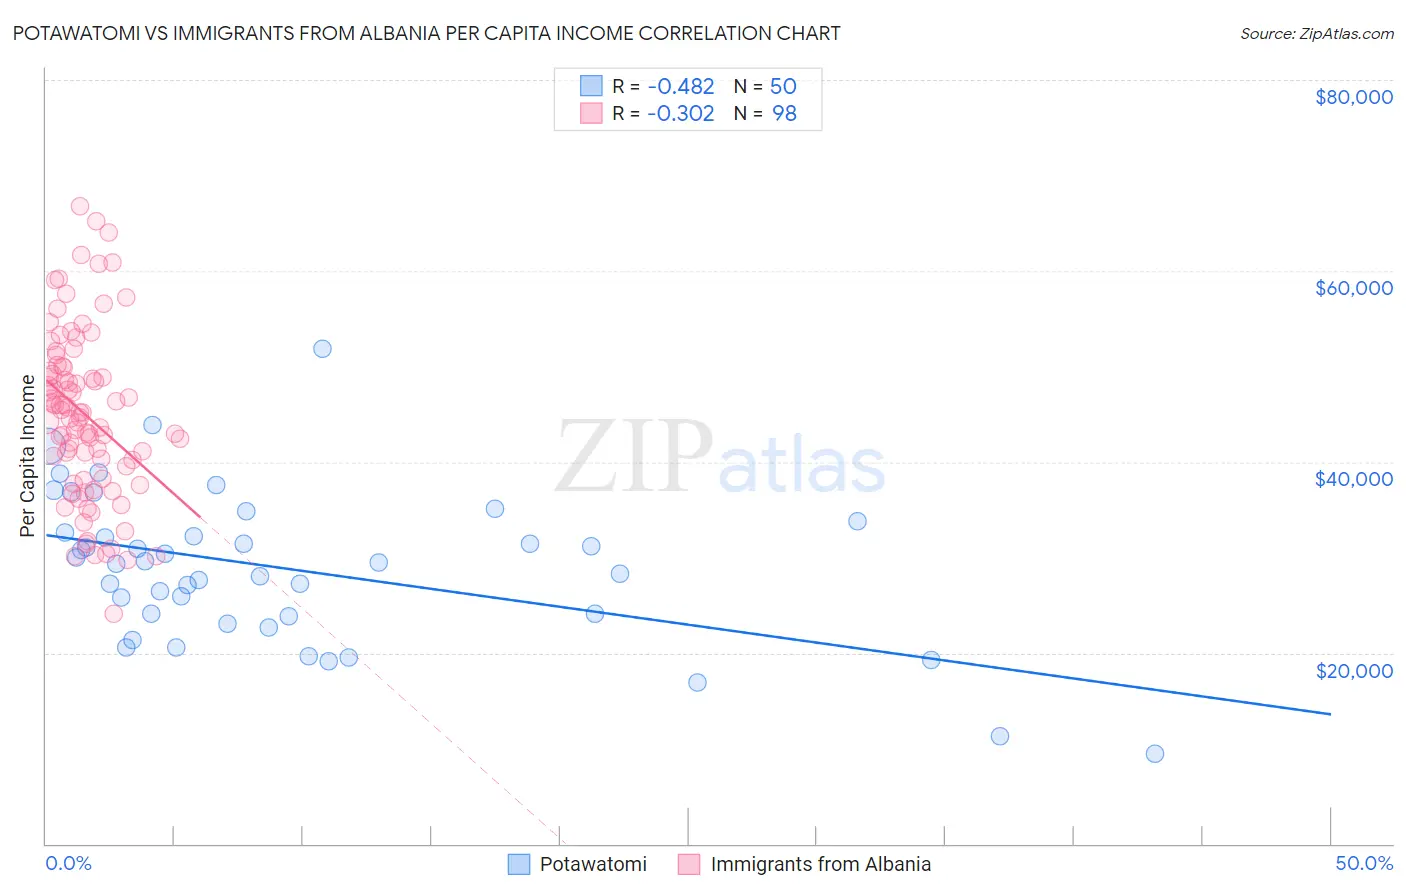
Potawatomi vs Immigrants from Albania Per Capita Income Correlation Chart
The statistical analysis conducted on geographies consisting of 117,768,459 people shows a moderate negative correlation between the proportion of Potawatomi and per capita income in the United States with a correlation coefficient (R) of -0.482 and weighted average of $38,046. Similarly, the statistical analysis conducted on geographies consisting of 119,376,608 people shows a mild negative correlation between the proportion of Immigrants from Albania and per capita income in the United States with a correlation coefficient (R) of -0.302 and weighted average of $46,387, a difference of 21.9%.
Per Capita Income Correlation Summary
| Measurement | Potawatomi | Immigrants from Albania |
| Minimum | $9,447 | $24,123 |
| Maximum | $51,870 | $66,738 |
| Range | $42,423 | $42,615 |
| Mean | $28,766 | $45,029 |
| Median | $29,420 | $45,153 |
| Interquartile 25% (IQ1) | $23,768 | $39,496 |
| Interquartile 75% (IQ3) | $32,549 | $49,916 |
| Interquartile Range (IQR) | $8,781 | $10,420 |
| Standard Deviation (Sample) | $7,980 | $8,753 |
| Standard Deviation (Population) | $7,900 | $8,708 |
Similar Demographics by Per Capita Income
Demographics Similar to Potawatomi by Per Capita Income
In terms of per capita income, the demographic groups most similar to Potawatomi are Colville ($38,047, a difference of 0.0%), Immigrants from Nicaragua ($38,065, a difference of 0.050%), Comanche ($38,088, a difference of 0.11%), Hmong ($38,120, a difference of 0.20%), and Immigrants from Dominica ($37,952, a difference of 0.25%).
| Demographics | Rating | Rank | Per Capita Income |
| Nepalese | 0.3 /100 | #273 | Tragic $38,442 |
| Immigrants | El Salvador | 0.3 /100 | #274 | Tragic $38,394 |
| Immigrants | Liberia | 0.2 /100 | #275 | Tragic $38,165 |
| Hmong | 0.2 /100 | #276 | Tragic $38,120 |
| Comanche | 0.2 /100 | #277 | Tragic $38,088 |
| Immigrants | Nicaragua | 0.2 /100 | #278 | Tragic $38,065 |
| Colville | 0.2 /100 | #279 | Tragic $38,047 |
| Potawatomi | 0.2 /100 | #280 | Tragic $38,046 |
| Immigrants | Dominica | 0.2 /100 | #281 | Tragic $37,952 |
| Immigrants | Laos | 0.1 /100 | #282 | Tragic $37,857 |
| Pennsylvania Germans | 0.1 /100 | #283 | Tragic $37,842 |
| Africans | 0.1 /100 | #284 | Tragic $37,785 |
| Guatemalans | 0.1 /100 | #285 | Tragic $37,766 |
| Central American Indians | 0.1 /100 | #286 | Tragic $37,699 |
| Dominicans | 0.1 /100 | #287 | Tragic $37,697 |
Demographics Similar to Immigrants from Albania by Per Capita Income
In terms of per capita income, the demographic groups most similar to Immigrants from Albania are Immigrants from Morocco ($46,430, a difference of 0.090%), Taiwanese ($46,455, a difference of 0.14%), Chilean ($46,459, a difference of 0.15%), Afghan ($46,268, a difference of 0.26%), and Immigrants from Northern Africa ($46,531, a difference of 0.31%).
| Demographics | Rating | Rank | Per Capita Income |
| Ethiopians | 96.3 /100 | #106 | Exceptional $46,569 |
| Serbians | 96.2 /100 | #107 | Exceptional $46,551 |
| Immigrants | Kuwait | 96.2 /100 | #108 | Exceptional $46,543 |
| Immigrants | Northern Africa | 96.2 /100 | #109 | Exceptional $46,531 |
| Chileans | 95.9 /100 | #110 | Exceptional $46,459 |
| Taiwanese | 95.8 /100 | #111 | Exceptional $46,455 |
| Immigrants | Morocco | 95.7 /100 | #112 | Exceptional $46,430 |
| Immigrants | Albania | 95.5 /100 | #113 | Exceptional $46,387 |
| Afghans | 94.9 /100 | #114 | Exceptional $46,268 |
| Immigrants | Chile | 94.6 /100 | #115 | Exceptional $46,213 |
| Poles | 94.1 /100 | #116 | Exceptional $46,123 |
| Chinese | 93.9 /100 | #117 | Exceptional $46,098 |
| Immigrants | Saudi Arabia | 93.3 /100 | #118 | Exceptional $46,008 |
| Immigrants | Poland | 93.1 /100 | #119 | Exceptional $45,979 |
| Immigrants | Ethiopia | 92.7 /100 | #120 | Exceptional $45,923 |