Potawatomi vs Immigrants from Eritrea Associate's Degree
COMPARE
Potawatomi
Immigrants from Eritrea
Associate's Degree
Associate's Degree Comparison
Potawatomi
Immigrants from Eritrea
40.4%
ASSOCIATE'S DEGREE
0.1/ 100
METRIC RATING
275th/ 347
METRIC RANK
48.1%
ASSOCIATE'S DEGREE
87.8/ 100
METRIC RATING
137th/ 347
METRIC RANK
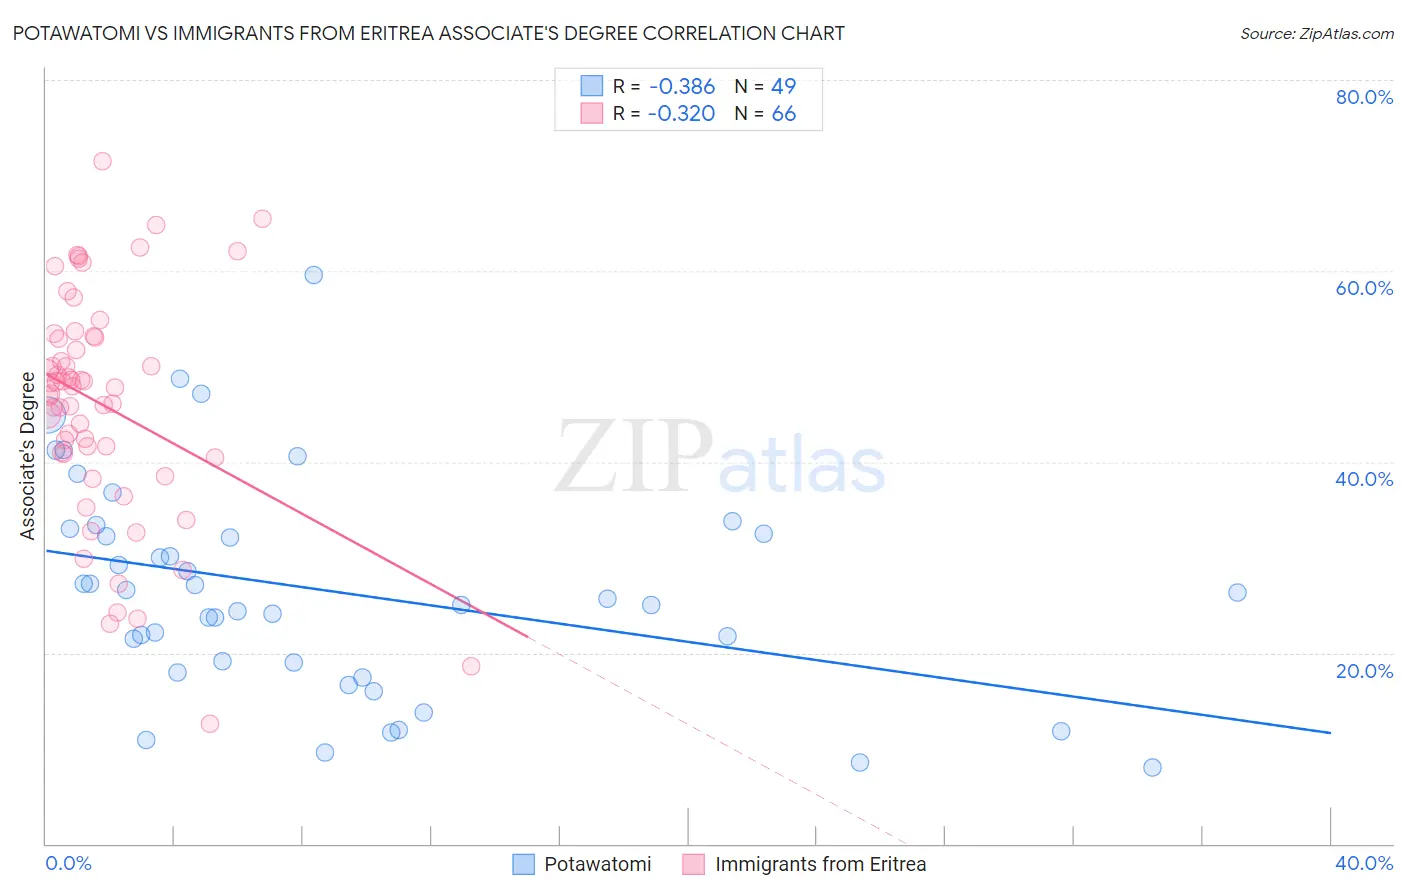
Potawatomi vs Immigrants from Eritrea Associate's Degree Correlation Chart
The statistical analysis conducted on geographies consisting of 117,773,349 people shows a mild negative correlation between the proportion of Potawatomi and percentage of population with at least associate's degree education in the United States with a correlation coefficient (R) of -0.386 and weighted average of 40.4%. Similarly, the statistical analysis conducted on geographies consisting of 104,852,788 people shows a mild negative correlation between the proportion of Immigrants from Eritrea and percentage of population with at least associate's degree education in the United States with a correlation coefficient (R) of -0.320 and weighted average of 48.1%, a difference of 19.0%.
Associate's Degree Correlation Summary
| Measurement | Potawatomi | Immigrants from Eritrea |
| Minimum | 8.0% | 12.6% |
| Maximum | 59.6% | 71.5% |
| Range | 51.6% | 58.9% |
| Mean | 26.5% | 46.0% |
| Median | 25.7% | 47.9% |
| Interquartile 25% (IQ1) | 18.5% | 40.9% |
| Interquartile 75% (IQ3) | 32.7% | 53.1% |
| Interquartile Range (IQR) | 14.3% | 12.2% |
| Standard Deviation (Sample) | 11.3% | 11.9% |
| Standard Deviation (Population) | 11.2% | 11.8% |
Similar Demographics by Associate's Degree
Demographics Similar to Potawatomi by Associate's Degree
In terms of associate's degree, the demographic groups most similar to Potawatomi are Puerto Rican (40.4%, a difference of 0.10%), Immigrants from Dominica (40.5%, a difference of 0.14%), Blackfeet (40.3%, a difference of 0.16%), Puget Sound Salish (40.5%, a difference of 0.28%), and Ottawa (40.3%, a difference of 0.30%).
| Demographics | Rating | Rank | Associate's Degree |
| Central American Indians | 0.2 /100 | #268 | Tragic 40.8% |
| Americans | 0.2 /100 | #269 | Tragic 40.8% |
| Chippewa | 0.2 /100 | #270 | Tragic 40.7% |
| Immigrants | Laos | 0.1 /100 | #271 | Tragic 40.7% |
| Belizeans | 0.1 /100 | #272 | Tragic 40.6% |
| Puget Sound Salish | 0.1 /100 | #273 | Tragic 40.5% |
| Immigrants | Dominica | 0.1 /100 | #274 | Tragic 40.5% |
| Potawatomi | 0.1 /100 | #275 | Tragic 40.4% |
| Puerto Ricans | 0.1 /100 | #276 | Tragic 40.4% |
| Blackfeet | 0.1 /100 | #277 | Tragic 40.3% |
| Ottawa | 0.1 /100 | #278 | Tragic 40.3% |
| Immigrants | Nicaragua | 0.1 /100 | #279 | Tragic 40.3% |
| Immigrants | Micronesia | 0.1 /100 | #280 | Tragic 40.2% |
| Immigrants | Portugal | 0.1 /100 | #281 | Tragic 40.1% |
| Bangladeshis | 0.1 /100 | #282 | Tragic 40.0% |
Demographics Similar to Immigrants from Eritrea by Associate's Degree
In terms of associate's degree, the demographic groups most similar to Immigrants from Eritrea are Pakistani (48.1%, a difference of 0.040%), Polish (48.0%, a difference of 0.070%), European (48.2%, a difference of 0.22%), Moroccan (48.2%, a difference of 0.28%), and Assyrian/Chaldean/Syriac (48.2%, a difference of 0.30%).
| Demographics | Rating | Rank | Associate's Degree |
| Immigrants | Jordan | 91.2 /100 | #130 | Exceptional 48.4% |
| Icelanders | 90.8 /100 | #131 | Exceptional 48.3% |
| Immigrants | Albania | 89.9 /100 | #132 | Excellent 48.2% |
| Assyrians/Chaldeans/Syriacs | 89.4 /100 | #133 | Excellent 48.2% |
| Moroccans | 89.3 /100 | #134 | Excellent 48.2% |
| Europeans | 89.0 /100 | #135 | Excellent 48.2% |
| Pakistanis | 88.0 /100 | #136 | Excellent 48.1% |
| Immigrants | Eritrea | 87.8 /100 | #137 | Excellent 48.1% |
| Poles | 87.3 /100 | #138 | Excellent 48.0% |
| Slovenes | 85.1 /100 | #139 | Excellent 47.9% |
| Immigrants | Southern Europe | 84.4 /100 | #140 | Excellent 47.8% |
| Taiwanese | 83.3 /100 | #141 | Excellent 47.7% |
| Sierra Leoneans | 82.9 /100 | #142 | Excellent 47.7% |
| Norwegians | 81.0 /100 | #143 | Excellent 47.6% |
| Slavs | 80.5 /100 | #144 | Excellent 47.6% |