Potawatomi vs Immigrants from Senegal Per Capita Income
COMPARE
Potawatomi
Immigrants from Senegal
Per Capita Income
Per Capita Income Comparison
Potawatomi
Immigrants from Senegal
$38,046
PER CAPITA INCOME
0.2/ 100
METRIC RATING
280th/ 347
METRIC RANK
$41,830
PER CAPITA INCOME
11.3/ 100
METRIC RATING
212th/ 347
METRIC RANK
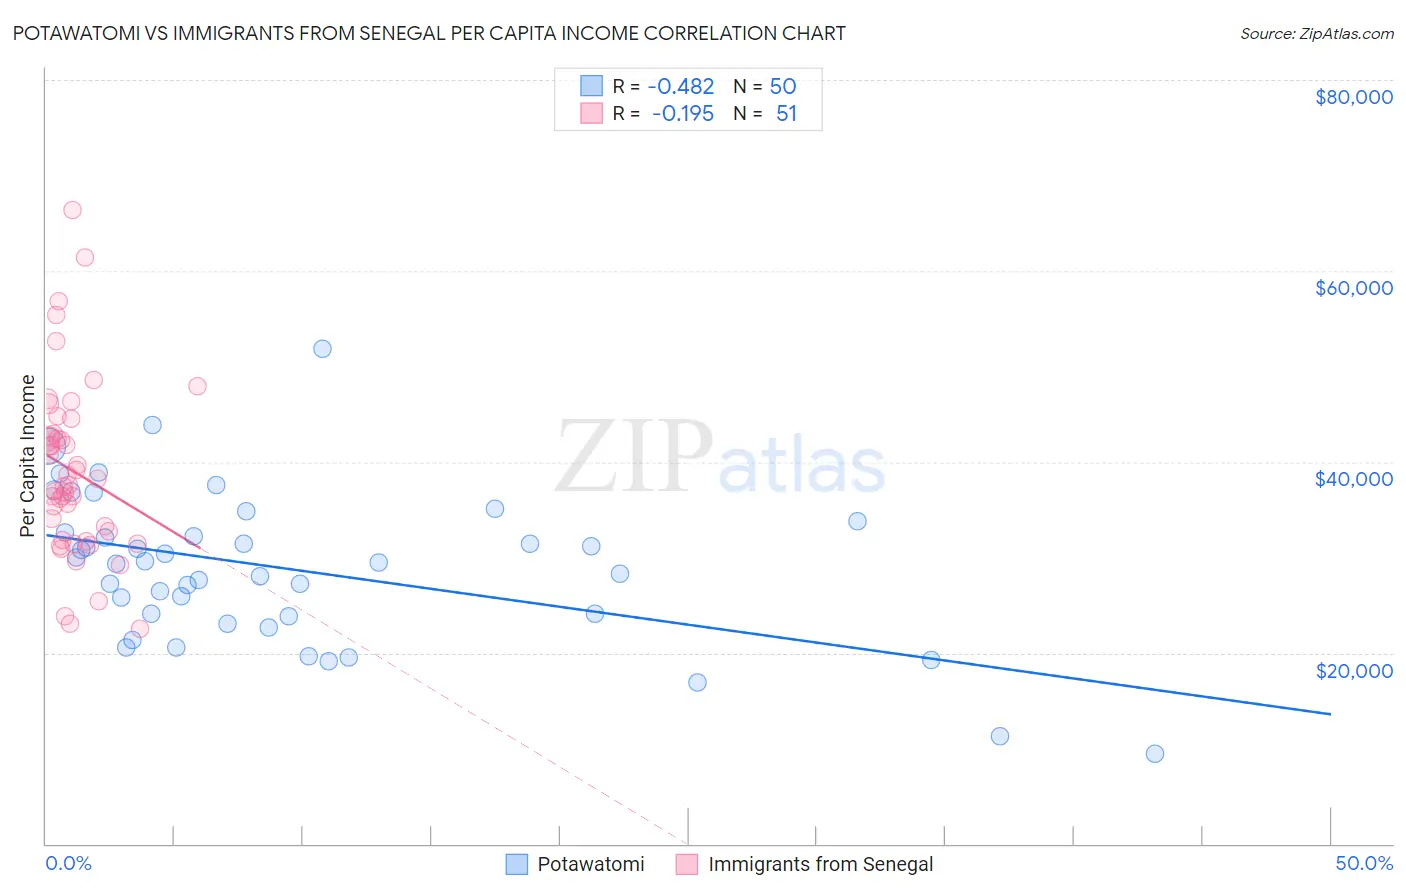
Potawatomi vs Immigrants from Senegal Per Capita Income Correlation Chart
The statistical analysis conducted on geographies consisting of 117,768,459 people shows a moderate negative correlation between the proportion of Potawatomi and per capita income in the United States with a correlation coefficient (R) of -0.482 and weighted average of $38,046. Similarly, the statistical analysis conducted on geographies consisting of 90,129,295 people shows a poor negative correlation between the proportion of Immigrants from Senegal and per capita income in the United States with a correlation coefficient (R) of -0.195 and weighted average of $41,830, a difference of 10.0%.
Per Capita Income Correlation Summary
| Measurement | Potawatomi | Immigrants from Senegal |
| Minimum | $9,447 | $22,459 |
| Maximum | $51,870 | $66,378 |
| Range | $42,423 | $43,919 |
| Mean | $28,766 | $39,027 |
| Median | $29,420 | $37,536 |
| Interquartile 25% (IQ1) | $23,768 | $31,835 |
| Interquartile 75% (IQ3) | $32,549 | $42,907 |
| Interquartile Range (IQR) | $8,781 | $11,072 |
| Standard Deviation (Sample) | $7,980 | $9,175 |
| Standard Deviation (Population) | $7,900 | $9,085 |
Similar Demographics by Per Capita Income
Demographics Similar to Potawatomi by Per Capita Income
In terms of per capita income, the demographic groups most similar to Potawatomi are Colville ($38,047, a difference of 0.0%), Immigrants from Nicaragua ($38,065, a difference of 0.050%), Comanche ($38,088, a difference of 0.11%), Hmong ($38,120, a difference of 0.20%), and Immigrants from Dominica ($37,952, a difference of 0.25%).
| Demographics | Rating | Rank | Per Capita Income |
| Nepalese | 0.3 /100 | #273 | Tragic $38,442 |
| Immigrants | El Salvador | 0.3 /100 | #274 | Tragic $38,394 |
| Immigrants | Liberia | 0.2 /100 | #275 | Tragic $38,165 |
| Hmong | 0.2 /100 | #276 | Tragic $38,120 |
| Comanche | 0.2 /100 | #277 | Tragic $38,088 |
| Immigrants | Nicaragua | 0.2 /100 | #278 | Tragic $38,065 |
| Colville | 0.2 /100 | #279 | Tragic $38,047 |
| Potawatomi | 0.2 /100 | #280 | Tragic $38,046 |
| Immigrants | Dominica | 0.2 /100 | #281 | Tragic $37,952 |
| Immigrants | Laos | 0.1 /100 | #282 | Tragic $37,857 |
| Pennsylvania Germans | 0.1 /100 | #283 | Tragic $37,842 |
| Africans | 0.1 /100 | #284 | Tragic $37,785 |
| Guatemalans | 0.1 /100 | #285 | Tragic $37,766 |
| Central American Indians | 0.1 /100 | #286 | Tragic $37,699 |
| Dominicans | 0.1 /100 | #287 | Tragic $37,697 |
Demographics Similar to Immigrants from Senegal by Per Capita Income
In terms of per capita income, the demographic groups most similar to Immigrants from Senegal are Immigrants from Panama ($41,853, a difference of 0.050%), Immigrants from Venezuela ($41,727, a difference of 0.25%), Immigrants from Bangladesh ($41,709, a difference of 0.29%), Ecuadorian ($41,958, a difference of 0.30%), and Sudanese ($41,695, a difference of 0.32%).
| Demographics | Rating | Rank | Per Capita Income |
| Whites/Caucasians | 15.9 /100 | #205 | Poor $42,180 |
| Ghanaians | 15.7 /100 | #206 | Poor $42,164 |
| Venezuelans | 14.4 /100 | #207 | Poor $42,074 |
| Panamanians | 13.9 /100 | #208 | Poor $42,035 |
| Immigrants | Sudan | 13.2 /100 | #209 | Poor $41,986 |
| Ecuadorians | 12.9 /100 | #210 | Poor $41,958 |
| Immigrants | Panama | 11.6 /100 | #211 | Poor $41,853 |
| Immigrants | Senegal | 11.3 /100 | #212 | Poor $41,830 |
| Immigrants | Venezuela | 10.2 /100 | #213 | Poor $41,727 |
| Immigrants | Bangladesh | 10.1 /100 | #214 | Poor $41,709 |
| Sudanese | 9.9 /100 | #215 | Tragic $41,695 |
| Tongans | 9.9 /100 | #216 | Tragic $41,693 |
| Guamanians/Chamorros | 9.7 /100 | #217 | Tragic $41,678 |
| Trinidadians and Tobagonians | 9.5 /100 | #218 | Tragic $41,655 |
| Puget Sound Salish | 8.1 /100 | #219 | Tragic $41,495 |