Pima vs African Currently Married
COMPARE
Pima
African
Currently Married
Currently Married Comparison
Pima
Africans
35.9%
CURRENTLY MARRIED
0.0/ 100
METRIC RATING
347th/ 347
METRIC RANK
41.8%
CURRENTLY MARRIED
0.0/ 100
METRIC RATING
307th/ 347
METRIC RANK
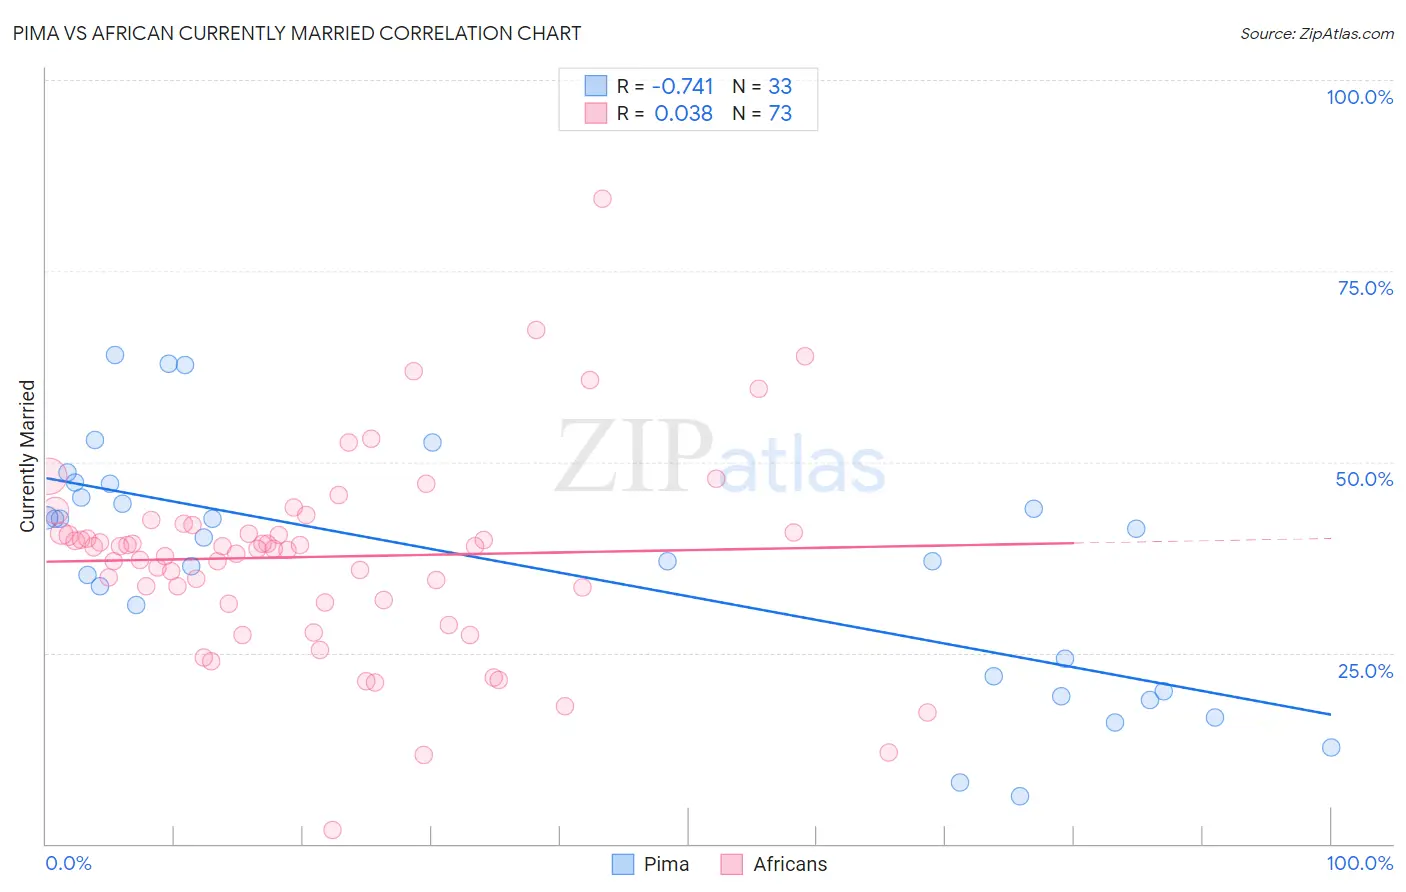
Pima vs African Currently Married Correlation Chart
The statistical analysis conducted on geographies consisting of 61,552,342 people shows a strong negative correlation between the proportion of Pima and percentage of population currently married in the United States with a correlation coefficient (R) of -0.741 and weighted average of 35.9%. Similarly, the statistical analysis conducted on geographies consisting of 470,023,481 people shows no correlation between the proportion of Africans and percentage of population currently married in the United States with a correlation coefficient (R) of 0.038 and weighted average of 41.8%, a difference of 16.5%.
Currently Married Correlation Summary
| Measurement | Pima | African |
| Minimum | 6.2% | 1.8% |
| Maximum | 64.0% | 84.5% |
| Range | 57.8% | 82.7% |
| Mean | 36.3% | 37.6% |
| Median | 40.1% | 38.9% |
| Interquartile 25% (IQ1) | 21.0% | 31.7% |
| Interquartile 75% (IQ3) | 46.2% | 41.2% |
| Interquartile Range (IQR) | 25.2% | 9.4% |
| Standard Deviation (Sample) | 15.6% | 12.9% |
| Standard Deviation (Population) | 15.4% | 12.8% |
Similar Demographics by Currently Married
Demographics Similar to Pima by Currently Married
In terms of currently married, the demographic groups most similar to Pima are Hopi (36.5%, a difference of 1.8%), Tohono O'odham (36.8%, a difference of 2.4%), Immigrants from Cabo Verde (37.8%, a difference of 5.4%), Pueblo (38.2%, a difference of 6.5%), and Immigrants from Dominican Republic (38.9%, a difference of 8.4%).
| Demographics | Rating | Rank | Currently Married |
| Yup'ik | 0.0 /100 | #333 | Tragic 39.9% |
| Puerto Ricans | 0.0 /100 | #334 | Tragic 39.9% |
| Lumbee | 0.0 /100 | #335 | Tragic 39.8% |
| British West Indians | 0.0 /100 | #336 | Tragic 39.8% |
| Blacks/African Americans | 0.0 /100 | #337 | Tragic 39.6% |
| Cape Verdeans | 0.0 /100 | #338 | Tragic 39.6% |
| Dominicans | 0.0 /100 | #339 | Tragic 39.5% |
| Immigrants | Grenada | 0.0 /100 | #340 | Tragic 39.1% |
| Navajo | 0.0 /100 | #341 | Tragic 39.0% |
| Immigrants | Dominican Republic | 0.0 /100 | #342 | Tragic 38.9% |
| Pueblo | 0.0 /100 | #343 | Tragic 38.2% |
| Immigrants | Cabo Verde | 0.0 /100 | #344 | Tragic 37.8% |
| Tohono O'odham | 0.0 /100 | #345 | Tragic 36.8% |
| Hopi | 0.0 /100 | #346 | Tragic 36.5% |
| Pima | 0.0 /100 | #347 | Tragic 35.9% |
Demographics Similar to Africans by Currently Married
In terms of currently married, the demographic groups most similar to Africans are Immigrants from Belize (41.8%, a difference of 0.040%), Immigrants from Guyana (41.9%, a difference of 0.13%), Immigrants from Trinidad and Tobago (41.9%, a difference of 0.14%), Immigrants from Liberia (41.8%, a difference of 0.15%), and Immigrants from Bahamas (41.9%, a difference of 0.18%).
| Demographics | Rating | Rank | Currently Married |
| Belizeans | 0.0 /100 | #300 | Tragic 42.2% |
| Immigrants | Yemen | 0.0 /100 | #301 | Tragic 42.1% |
| Immigrants | Zaire | 0.0 /100 | #302 | Tragic 42.0% |
| Sioux | 0.0 /100 | #303 | Tragic 41.9% |
| Immigrants | Bahamas | 0.0 /100 | #304 | Tragic 41.9% |
| Immigrants | Trinidad and Tobago | 0.0 /100 | #305 | Tragic 41.9% |
| Immigrants | Guyana | 0.0 /100 | #306 | Tragic 41.9% |
| Africans | 0.0 /100 | #307 | Tragic 41.8% |
| Immigrants | Belize | 0.0 /100 | #308 | Tragic 41.8% |
| Immigrants | Liberia | 0.0 /100 | #309 | Tragic 41.8% |
| Guyanese | 0.0 /100 | #310 | Tragic 41.6% |
| Trinidadians and Tobagonians | 0.0 /100 | #311 | Tragic 41.5% |
| Somalis | 0.0 /100 | #312 | Tragic 41.5% |
| Jamaicans | 0.0 /100 | #313 | Tragic 41.4% |
| West Indians | 0.0 /100 | #314 | Tragic 41.3% |