Pima vs African Unemployment Among Ages 55 to 59 years
COMPARE
Pima
African
Unemployment Among Ages 55 to 59 years
Unemployment Among Ages 55 to 59 years Comparison
Pima
Africans
6.6%
UNEMPLOYMENT AMONG AGES 55 TO 59 YEARS
0.0/ 100
METRIC RATING
333rd/ 347
METRIC RANK
5.1%
UNEMPLOYMENT AMONG AGES 55 TO 59 YEARS
0.1/ 100
METRIC RATING
261st/ 347
METRIC RANK
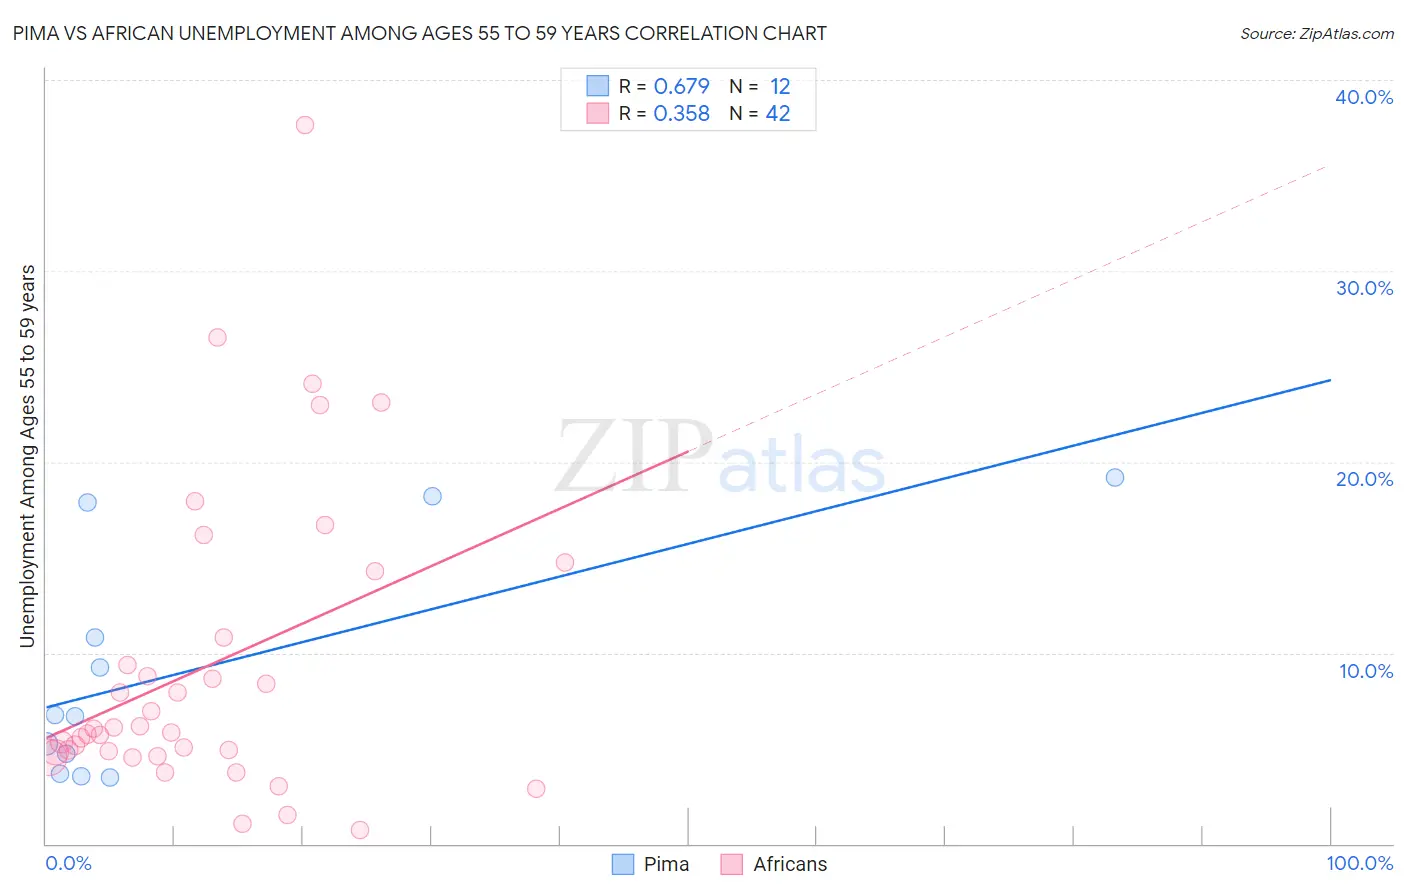
Pima vs African Unemployment Among Ages 55 to 59 years Correlation Chart
The statistical analysis conducted on geographies consisting of 60,402,729 people shows a significant positive correlation between the proportion of Pima and unemployment rate among population between the ages 55 and 59 in the United States with a correlation coefficient (R) of 0.679 and weighted average of 6.6%. Similarly, the statistical analysis conducted on geographies consisting of 427,769,430 people shows a mild positive correlation between the proportion of Africans and unemployment rate among population between the ages 55 and 59 in the United States with a correlation coefficient (R) of 0.358 and weighted average of 5.1%, a difference of 28.8%.
Unemployment Among Ages 55 to 59 years Correlation Summary
| Measurement | Pima | African |
| Minimum | 3.5% | 0.70% |
| Maximum | 19.2% | 37.6% |
| Range | 15.7% | 36.9% |
| Mean | 9.1% | 9.3% |
| Median | 6.7% | 5.9% |
| Interquartile 25% (IQ1) | 4.2% | 4.8% |
| Interquartile 75% (IQ3) | 14.3% | 10.8% |
| Interquartile Range (IQR) | 10.2% | 6.0% |
| Standard Deviation (Sample) | 6.1% | 7.9% |
| Standard Deviation (Population) | 5.8% | 7.8% |
Similar Demographics by Unemployment Among Ages 55 to 59 years
Demographics Similar to Pima by Unemployment Among Ages 55 to 59 years
In terms of unemployment among ages 55 to 59 years, the demographic groups most similar to Pima are Pueblo (6.7%, a difference of 1.2%), Colville (6.7%, a difference of 1.4%), Navajo (6.7%, a difference of 1.6%), Paiute (6.8%, a difference of 2.1%), and Aleut (6.4%, a difference of 2.8%).
| Demographics | Rating | Rank | Unemployment Among Ages 55 to 59 years |
| Natives/Alaskans | 0.0 /100 | #326 | Tragic 6.0% |
| Arapaho | 0.0 /100 | #327 | Tragic 6.1% |
| Yuman | 0.0 /100 | #328 | Tragic 6.1% |
| Dominicans | 0.0 /100 | #329 | Tragic 6.2% |
| Alaska Natives | 0.0 /100 | #330 | Tragic 6.2% |
| Immigrants | Dominican Republic | 0.0 /100 | #331 | Tragic 6.3% |
| Aleuts | 0.0 /100 | #332 | Tragic 6.4% |
| Pima | 0.0 /100 | #333 | Tragic 6.6% |
| Pueblo | 0.0 /100 | #334 | Tragic 6.7% |
| Colville | 0.0 /100 | #335 | Tragic 6.7% |
| Navajo | 0.0 /100 | #336 | Tragic 6.7% |
| Paiute | 0.0 /100 | #337 | Tragic 6.8% |
| Immigrants | Yemen | 0.0 /100 | #338 | Tragic 6.9% |
| Puerto Ricans | 0.0 /100 | #339 | Tragic 7.0% |
| Alaskan Athabascans | 0.0 /100 | #340 | Tragic 7.1% |
Demographics Similar to Africans by Unemployment Among Ages 55 to 59 years
In terms of unemployment among ages 55 to 59 years, the demographic groups most similar to Africans are Immigrants from El Salvador (5.1%, a difference of 0.070%), Immigrants from Western Africa (5.1%, a difference of 0.11%), Immigrants from West Indies (5.1%, a difference of 0.21%), Immigrants from Sierra Leone (5.2%, a difference of 0.26%), and Salvadoran (5.1%, a difference of 0.30%).
| Demographics | Rating | Rank | Unemployment Among Ages 55 to 59 years |
| Seminole | 0.3 /100 | #254 | Tragic 5.1% |
| Blackfeet | 0.3 /100 | #255 | Tragic 5.1% |
| Senegalese | 0.3 /100 | #256 | Tragic 5.1% |
| Central Americans | 0.2 /100 | #257 | Tragic 5.1% |
| Salvadorans | 0.2 /100 | #258 | Tragic 5.1% |
| Immigrants | West Indies | 0.2 /100 | #259 | Tragic 5.1% |
| Immigrants | Western Africa | 0.2 /100 | #260 | Tragic 5.1% |
| Africans | 0.1 /100 | #261 | Tragic 5.1% |
| Immigrants | El Salvador | 0.1 /100 | #262 | Tragic 5.1% |
| Immigrants | Sierra Leone | 0.1 /100 | #263 | Tragic 5.2% |
| Immigrants | Caribbean | 0.1 /100 | #264 | Tragic 5.2% |
| Yaqui | 0.1 /100 | #265 | Tragic 5.2% |
| Jamaicans | 0.1 /100 | #266 | Tragic 5.2% |
| Immigrants | Senegal | 0.1 /100 | #267 | Tragic 5.2% |
| Mexicans | 0.1 /100 | #268 | Tragic 5.2% |